IMAGE

Figure 3

ID
ZDB-IMAGE-200312-10
Source
Figures for Hoelscher et al., 2020
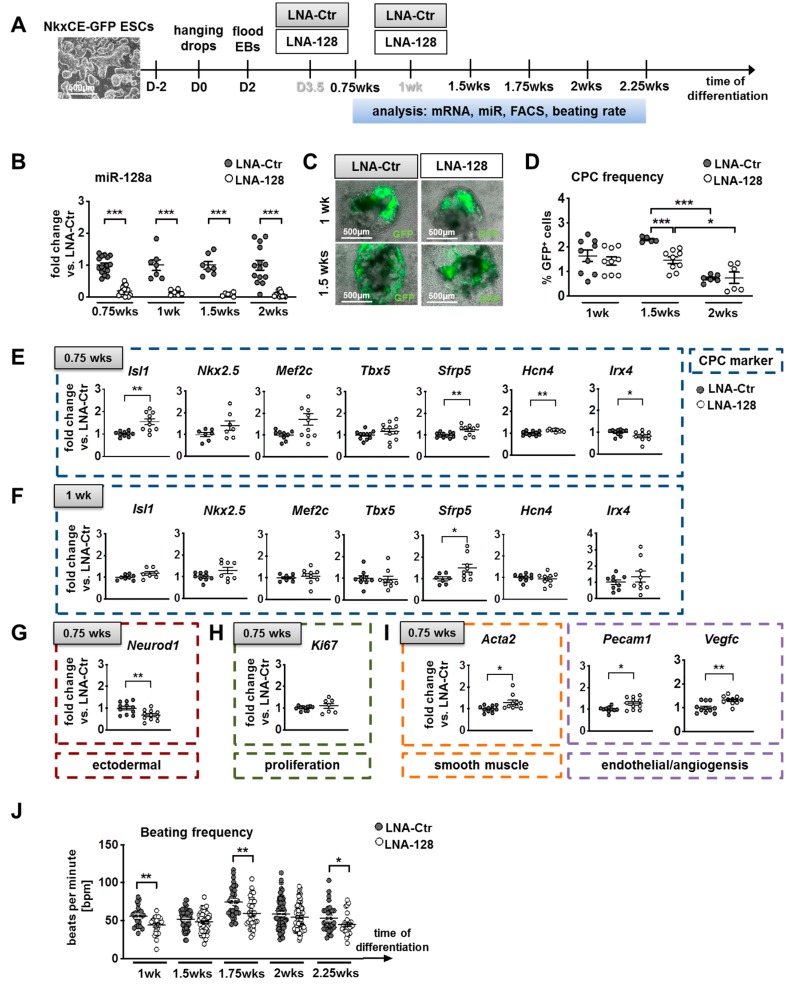
Image
Figure Caption

Figure 3

Knockdown of miR-128a during in vitro differentiation of murine NkxCE-GFP embryonic stem cells (ESCs). (A) NkxCE-GFP ESCs (scale bar: 500 µm) were differentiated using the hanging drop method. Transfections of locked nucleic acid (LNA) probes for knockdown of miR-128a (LNA-128) and corresponding non-targeting controls (LNA-Ctr) were performed on day 3.5 (D3.5) and after one week (wk) of differentiation. Analysis was performed on respective timepoints between 0.75 and 2.25 wks. Abbreviations: EB: Embryoid bodies; FACS: Flow cytometry; (B) MiR-128a was significantly downregulated (p < 0.001, Mann–Whitney test) by LNA-128 from 0.75 wks until 2 wks when compared to respective LNA-Ctrs. At least 3 assays in triplicates were performed per time-point. (C) NkxCE-GFP-positive CPCs after 1 wk (upper panel, scale bars: 500 µm) and 1.5 wks (lower panel, scale bars: 500 µm) after transfection with either LNA-Ctr or LNA-128. The images are an overlay between phase contrast and fluorescent pictures. (D) The frequency of NkxCE-GFP-positive CPCs with miR-128 knockdown (n = 9) was slightly reduced after 1 wk, becoming significantly downregulated after 1.5 wks (n = 5, 9; p = 0.001, Mann–Whitney test). The CPC frequency after 2 wks was not affected by LNA-128 compared to LNA-Ctr (n = 6). 3 assays in triplicates for 1 wks and 1.5 wks, 2 assays in triplicates for 2 wks. (EI). Gene expression panels during NkxCE-GFP ESC differentiation after miR-128 knockdown. The panels show the expression of early CPC markers after 0.75 wks (n = 11, 4 assays in triplicates, t-test or Mann–Whitney test) (E) and 1 wk (n = 9, 3 assays in triplicates, t-test or Mann–Whitney test) (F) as well as neuroectodermal (t-test) (G), proliferation (H), smooth muscle (Mann–Whitney test), endothelial, and angiogenesis markers (t-test) (I) after 0.75 wks. (J) Beating frequency (beats per minute, bpm) of early cardiomyocytes was downregulated from 1 wk to 2.25 wks on mir-128a knockdown compared to LNA-Ctr (n > 23, t-tests) (at least 4 assays, for 2.25 wks 2 assays, 8 videos were evaluated per condition from 3 independent observers). Data are represented as means ± SEM. * p ≤ 0.05, ** p ≤ 0.01 and *** p ≤ 0.001.

Acknowledgments
This image is the copyrighted work of the attributed author or publisher, and ZFIN has permission only to display this image to its users. Additional permissions should be obtained from the applicable author or publisher of the image. Full text @ Int. J. Mol. Sci.