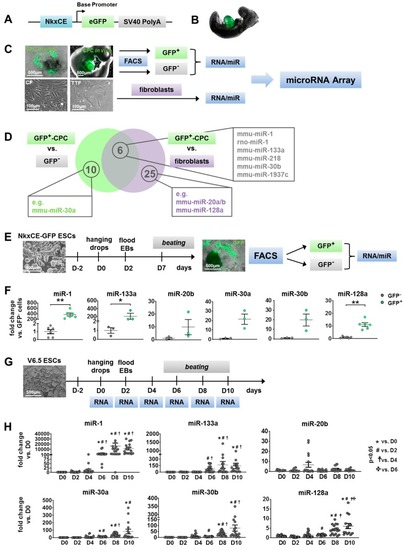
Identification of candidate microRNAs (miRs) during cardiac development. (A) Nkx2.5 cardiac enhancer eGFP (NkxCE-GFP) vector construct: (B) The cardiac specific NkxCE (~9.5kb upstream of Nkx2.5-ATG site) exclusively marks cardiac progenitor cells (CPCs) in embryonic hearts by GFP expression, as shown in an E9.5 mouse embryo. (C) Generation of cells for microRNA (miR) Array: GFP-positive cardiac progenitor cells (CPCs) and correspondent GFP negative cell fractions were sorted by flow cytometry (FACS) from E9.5 mouse embryos and in vitro differentiations on day 7 (D7) (upper images, scale bars: 500 µm). RNA/miR was isolated from murine tail tip fibroblasts (TTFs) and cardiac fibroblasts (CFs) (lower images, scale bars: 100 µm) for comparative analysis of miR expression profiles. (D) Venn diagram of upregulated miR candidates from miR Array analysis. 16 miRs were up-regulated (>1.5-fold, p < 0.05) in GFP-positive CPCs compared to their GFP-negative counterparts and 31 miRs were up-regulated in comparison to fibroblast populations (TTFs, CFs). Six of these miRs (e.g., miR-1, -133a, -30b, miR-218) were enriched in GFP-positive CPCs versus both GFP-negative cells and fibroblasts. (E) Experimental setup of in vitro differentiation (hanging drop method) of NkxCE-GFP ESCs for verification of miR candidates (scale bars: 500 µm). At differentiation day 7 (D7), GFP-positive CPCs and GFP-negative cell fractions were sorted by FACS, and total RNA was purified. (F) CPC marker miRs miR-1 (n = 6, Mann–Whitney test, p = 0.0022) and miR-133a (n = 3, t-test, p = 0.0465) were significantly upregulated at D7 in NkxCE-GFP CPCs in comparison to stage-matched negative cells, whereas only miR-128a (n = 6, Mann–Whitney-test, p = 0.0022) was significantly enriched of candidate miRs in NkxCE GFP-positive CPCs. No significance was found for miR-20b, -30a, and -30b (n = 3 each, t-test). Three assays were performed, whereas only for miR-1 and miR-128, samples were measured in duplicates. (G) To evaluate miR kinetics during in vitro differentiation, non-transgenic murine ESCs (V6.5, scale bar: 500 µm) were differentiated (hanging drop method) until day 10. RNA was isolated every other day for qRT-PCR. (H) Expression of miR-1 and -133a followed a typical course by rising at the beginning of cardiomyogenesis around D4 to D6. MiR-30a, -30b, and -128a also rose around D4 to D8. However, expression of miR-20b appears to be biphasic with a peak on D4 and D8. Three assays were performed in triplicate (n = 9 per timepoint; each sample was measured in duplicates n = 18 per timepoint; ANOVA followed by Dunn’s Method). All data are represented as means ±SEM. * p ≤ 0.05, ** p ≤ 0.01.
|
