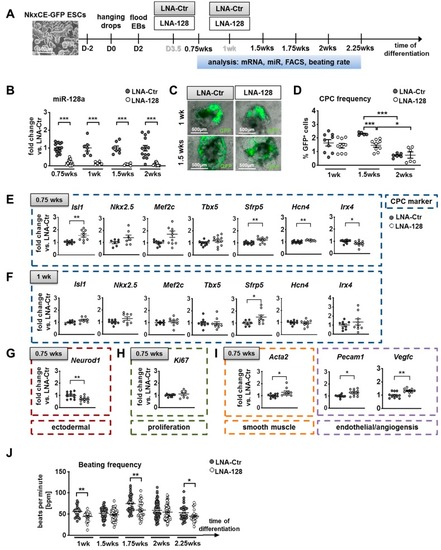
Knockdown of miR-128a during in vitro differentiation of murine NkxCE-GFP embryonic stem cells (ESCs). (A) NkxCE-GFP ESCs (scale bar: 500 µm) were differentiated using the hanging drop method. Transfections of locked nucleic acid (LNA) probes for knockdown of miR-128a (LNA-128) and corresponding non-targeting controls (LNA-Ctr) were performed on day 3.5 (D3.5) and after one week (wk) of differentiation. Analysis was performed on respective timepoints between 0.75 and 2.25 wks. Abbreviations: EB: Embryoid bodies; FACS: Flow cytometry; (B) MiR-128a was significantly downregulated (p < 0.001, Mann–Whitney test) by LNA-128 from 0.75 wks until 2 wks when compared to respective LNA-Ctrs. At least 3 assays in triplicates were performed per time-point. (C) NkxCE-GFP-positive CPCs after 1 wk (upper panel, scale bars: 500 µm) and 1.5 wks (lower panel, scale bars: 500 µm) after transfection with either LNA-Ctr or LNA-128. The images are an overlay between phase contrast and fluorescent pictures. (D) The frequency of NkxCE-GFP-positive CPCs with miR-128 knockdown (n = 9) was slightly reduced after 1 wk, becoming significantly downregulated after 1.5 wks (n = 5, 9; p = 0.001, Mann–Whitney test). The CPC frequency after 2 wks was not affected by LNA-128 compared to LNA-Ctr (n = 6). 3 assays in triplicates for 1 wks and 1.5 wks, 2 assays in triplicates for 2 wks. (E–I). Gene expression panels during NkxCE-GFP ESC differentiation after miR-128 knockdown. The panels show the expression of early CPC markers after 0.75 wks (n = 11, 4 assays in triplicates, t-test or Mann–Whitney test) (E) and 1 wk (n = 9, 3 assays in triplicates, t-test or Mann–Whitney test) (F) as well as neuroectodermal (t-test) (G), proliferation (H), smooth muscle (Mann–Whitney test), endothelial, and angiogenesis markers (t-test) (I) after 0.75 wks. (J) Beating frequency (beats per minute, bpm) of early cardiomyocytes was downregulated from 1 wk to 2.25 wks on mir-128a knockdown compared to LNA-Ctr (n > 23, t-tests) (at least 4 assays, for 2.25 wks 2 assays, 8 videos were evaluated per condition from 3 independent observers). Data are represented as means ± SEM. * p ≤ 0.05, ** p ≤ 0.01 and *** p ≤ 0.001.
|
