IMAGE

Figure 1

ID
ZDB-IMAGE-200312-6
Source
Figures for Hoelscher et al., 2020
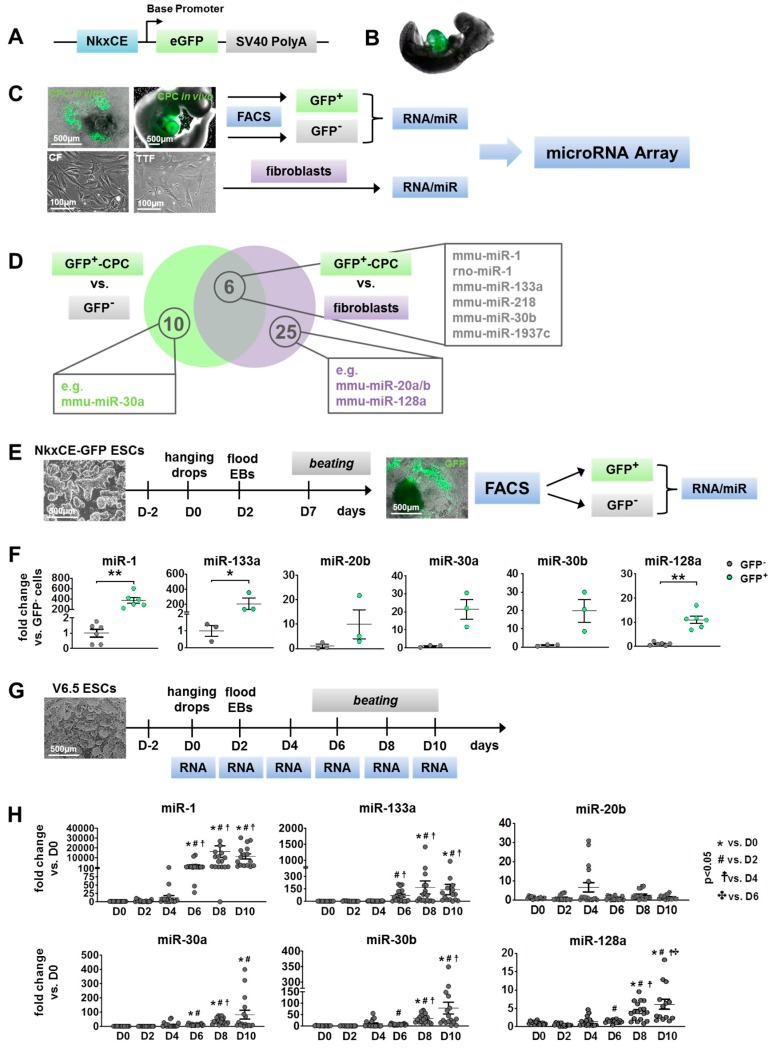
Image
Figure Caption

Figure 1

Identification of candidate microRNAs (miRs) during cardiac development. (A) Nkx2.5 cardiac enhancer eGFP (NkxCE-GFP) vector construct: (B) The cardiac specific NkxCE (~9.5kb upstream of Nkx2.5-ATG site) exclusively marks cardiac progenitor cells (CPCs) in embryonic hearts by GFP expression, as shown in an E9.5 mouse embryo. (C) Generation of cells for microRNA (miR) Array: GFP-positive cardiac progenitor cells (CPCs) and correspondent GFP negative cell fractions were sorted by flow cytometry (FACS) from E9.5 mouse embryos and in vitro differentiations on day 7 (D7) (upper images, scale bars: 500 µm). RNA/miR was isolated from murine tail tip fibroblasts (TTFs) and cardiac fibroblasts (CFs) (lower images, scale bars: 100 µm) for comparative analysis of miR expression profiles. (D) Venn diagram of upregulated miR candidates from miR Array analysis. 16 miRs were up-regulated (>1.5-fold, p < 0.05) in GFP-positive CPCs compared to their GFP-negative counterparts and 31 miRs were up-regulated in comparison to fibroblast populations (TTFs, CFs). Six of these miRs (e.g., miR-1, -133a, -30b, miR-218) were enriched in GFP-positive CPCs versus both GFP-negative cells and fibroblasts. (E) Experimental setup of in vitro differentiation (hanging drop method) of NkxCE-GFP ESCs for verification of miR candidates (scale bars: 500 µm). At differentiation day 7 (D7), GFP-positive CPCs and GFP-negative cell fractions were sorted by FACS, and total RNA was purified. (F) CPC marker miRs miR-1 (n = 6, Mann–Whitney test, p = 0.0022) and miR-133a (n = 3, t-test, p = 0.0465) were significantly upregulated at D7 in NkxCE-GFP CPCs in comparison to stage-matched negative cells, whereas only miR-128a (n = 6, Mann–Whitney-test, p = 0.0022) was significantly enriched of candidate miRs in NkxCE GFP-positive CPCs. No significance was found for miR-20b, -30a, and -30b (n = 3 each, t-test). Three assays were performed, whereas only for miR-1 and miR-128, samples were measured in duplicates. (G) To evaluate miR kinetics during in vitro differentiation, non-transgenic murine ESCs (V6.5, scale bar: 500 µm) were differentiated (hanging drop method) until day 10. RNA was isolated every other day for qRT-PCR. (H) Expression of miR-1 and -133a followed a typical course by rising at the beginning of cardiomyogenesis around D4 to D6. MiR-30a, -30b, and -128a also rose around D4 to D8. However, expression of miR-20b appears to be biphasic with a peak on D4 and D8. Three assays were performed in triplicate (n = 9 per timepoint; each sample was measured in duplicates n = 18 per timepoint; ANOVA followed by Dunn’s Method). All data are represented as means ±SEM. * p ≤ 0.05, ** p ≤ 0.01.

Acknowledgments
This image is the copyrighted work of the attributed author or publisher, and ZFIN has permission only to display this image to its users. Additional permissions should be obtained from the applicable author or publisher of the image. Full text @ Int. J. Mol. Sci.