
- Title
-
Pituicyte Cues Regulate the Development of Permeable Neuro-Vascular Interfaces
- Authors
- Anbalagan, S., Gordon, L., Blechman, J., Matsuoka, R.L., Rajamannar, P., Wircer, E., Biran, J., Reuveny, A., Leshkowitz, D., Stainier, D.Y.R., Levkowitz, G.
- Source
- Full text @ Dev. Cell
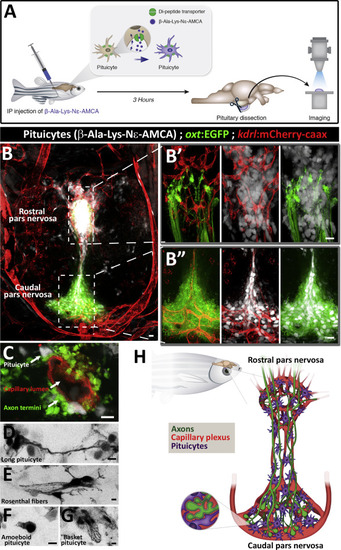
Pituicytes, Axons, and Blood Capillaries Form Multiple Neurovascular Interfaces (A) Scheme describing functional labeling of pituicytes in vivo. Injection of the fluorescent aminomethylcoumarin-(AMCA) conjugated diamino acid peptide ?-Ala-Lys-N? intraperitoneally (IP) into adult zebrafish leads to active uptake of ?-Ala-Lys-N?-AMCA by pituicytes. 3 hr following injection, the hypophysis was dissected and imaged. (B) Whole-mount imaging of hypophysis dissected from 3-month-old transgenic reporter zebrafish allowing simultaneous visualization of neurohypophyseal axons, labeled by Tg(oxt:EGFP), and blood capillaries, labeled by Tg(kdrl:mCherry-caax), shows ?-Ala-Lys-N?-AMCA-labeled pituicytes. Scale bar, 5 ?m. The axo-glial-vasal interface is seen in both the rostral (B?) and caudal (B??) pars nervosa of the neurohypophysis. Scale bar: 10 ?m. (C) High magnification of a neurovascular unit showing pituicytes and neurohypophyseal axon termini interfacing with a single blood capillary. Scale bar: 5 ?m. (D?G) Inverted gray scale high-magnification images of morphologically distinct pituicyte subtypes. Four major subtypes were identified: long processes connecting multiple pituicytes (D), pituicytes forming Rosenthal fibers (E), amoeboid pituicytes (F), and basket pituicytes (G). Scale bar: 5 ?m. (H) Schematic three-dimensional model of the adult zebrafish neurohypophysis. Hypophyseal axons (green), blood capillaries plexus (red), and pituicytes (magenta) are the main components of the neurohypophysis. Axo-glial-vasal contacts are mainly present in the rostral and caudal pars nervosa. Inset: enlarged scheme of an axo-glio-vasal neurovascular unit depicting engulfment of axon swellings by pituicytes that also contact the perivascular space of blood capillaries. |
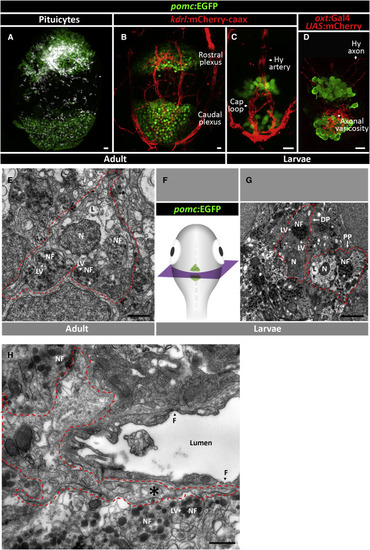
Tissue Organization and Ultrastructure of Adult and Larval Pituicytes (A and B) Confocal maximal intensity image of a 3-month-old zebrafish hypophysis showing the spatial distribution of ?-Ala-Lys-N?-AMCA-labeled pituicytes (A), which intermingle with, but do not co-localize with adenohypophyseal proopiomelanocortin-(POMC) positive cells marked by the Tg(pomc:EGFP) transgenic reporter (A and B). The two main clusters of POMC+ cells that abut the pituicytes are located within the rostral and caudal hypophyseal Tg(kdrl:mCherry-caax)-labeled capillary plexus in the adult. Scale bars: 10 ?M. (C and D) The spatial organization of the two anterior and posterior POMC-positive clusters in 9 dpf larva, where they abut the hypophyseal capillary loop and artery (C) and projecting neurohypophyseal axons (D), marked by Tg(oxt:EGFP). Scale bars: 10 ?M. (E?H) Transmitted electron microscope (TEM) imaging of 3-month-old adult (E and H) and larval (9 dpf) (G) pituicytes. Correlative confocal imaging of hypophyseal POMC+ cells was used as an anatomical landmark to localize the position of adult and larval pituicytes prior to tissue sectioning (F) and TEM imaging. Representative pituicytes are delimited by red dashed lines. Note the pituicyte-specific cellular features such as a prominent nucleus [N], lipid droplets [L], and engulfment of nerve fibers [NF] that are filled with large electron-dense core vesicles [LV] and pituicyte projection [?] separating nerve fibers from fenestrated capillaries [F]. DP, dense pituicyte; PP, pale pituicyte. Scale bars: 1 ?m. |
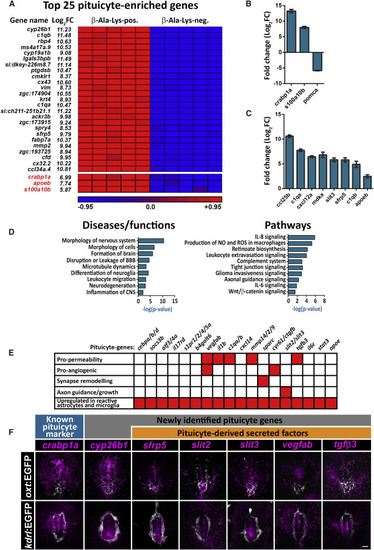
Molecular Signature and Pathway Analyses of Adult Pituicytes (A) Heatmap showing normalized expression levels (red = high, blue = low) of the most highly enriched 25 pituicyte genes obtained by RNA-seq of FACS-sorted, ?-Ala-Lys-N?-AMCA-labeled cells from five independent pools (7 animals each) of dissected hypophyses. Genes whose expression was upregulated in the ?-Ala-Lys-positive (pos.) versus ?-Ala-Lys-negative (neg.) cell population are ordered by statistical significance (adjusted p value). The log2-fold change (log2FC) showing the extent of gene expression enrichment is indicated. Previously known pituicyte markers are highlighted in red at the bottom of the list. (B and C) Graph showing validation of the RNA-seq results by quantitative real-time PCR analyses of known pituicyte markers (B) and selected novel pituicyte-derived secreted factors. FACS-sorted ?-Ala-Lys-N?-AMCA-positive; pomc:EGFP-negative cells were compared to ?-Ala-Lys-N?-AMCA-negative populations (C) (see also Figure S2). Pituicyte markers crabp1a and s100a10b are highly upregulated in ?-Ala-Lys-N?-AMCA-positive; pomc:EGFP-negative population, whereas the adenohypophyseal marker pomca is downregulated, indicating a high degree of enrichment for pituicytes over other hypophyseal cell types. Error bars indicate SD. (D) Graph showing the top statistically enriched terms for the diseases, functions, and signaling pathways of pituicyte-enriched genes, as determined by Ingenuity Pathway Analysis (see also Table S3). The x axis represents the negative logarithmic (-log10) p value for each term. (E) Matrix of selected pituicyte-enriched genes and their associated function as reported in the literature. Red-colored boxes denote the function or upregulation of the gene in reactive astrocytes or microglia. As seen in the bottom line, most of the genes have previously been shown to be upregulated in reactive astrocytes or microglia. (F) Confocal z stack images showing fluorescent in situ hybridization (FISH) of transgenic larvae (5?8 dpf) using probes directed against mRNAs of known and selected novel pituicyte-specific genes, followed by anti-EGFP staining. The neurohypophyseal area in which either the axonal termini [Tg(oxt:EGFP), top] or capillary loop [Tg(kdrl:EGFP)] were labeled is shown. Scale bar: 5 ?m. |
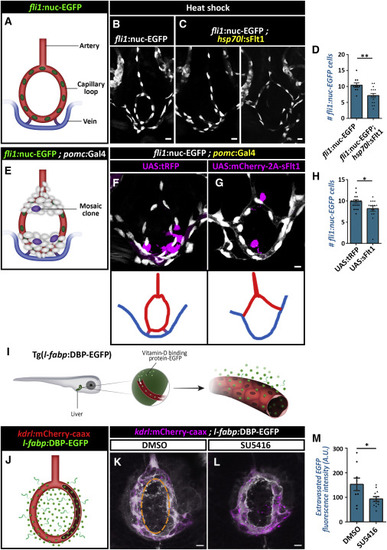
Vegf Signaling Regulates Hypophyseal Capillary Morphogenesis and Permeability (A?D) Morphological analysis and cell count of the hypophyseal artery and capillary loop and vein using the Tg(fli1:nuc-EGFP) line, which labels endothelial cell nuclei (A). The transgenic line Tg(hsp70l:sFlt1) was used to inhibit Vegf/Vegfr2 signaling temporally. Control (B, n = 10) and Tg(hsp70l:sFlt1) larvae (C, n = 15) were subjected to multiple 28?C to 37?C temperature shifts between 3 dpf and 5 dpf. The capillary loop cell number (D) was significantly higher in Tg(hsp70l:sflt1) larvae (??p < 0.01; Student?s t test). Correlation between the co-occurrence of abnormal loops and temporally induced sFlt1 expression was determined by calculating the phi coefficient of association, followed by Fisher?s exact test (n = 6/15; p < 0.03). Scale bars: 10 ?m. (E?H) Hypophyseal clones (E) overexpressing control tRFP (F) or the soluble antagonist sFlt1 (E and G). Double transgenic Tg(pomc:Gal4;fli1:nuc-EGFP) embryos were injected with transposon-based transgenic expression vectors containing either control UAS:tRFP (n = 19) or UAS:mCherry-2A-sFlt1 (n = 15), allowing for mosaic gene expression in discrete hypophyseal cells (magenta). Cell numbers in the capillary loop (H) were significantly higher in the mutant (?p < 0.05; Mann-Whitney test). The schemata shown at the bottom of panels depict the normal (F) and abnormal (G) connectivity of the hypophyseal capillary loop in 5 dpf larvae with mosaic expression. Correlation between the co-occurrence of the abnormal loop and sFlt1 clones was determined by calculating the phi coefficient of association, followed by Fisher?s exact test (n = 5/15; p < 0.05). Scale bars: 5 ?m. (I?M) Assessment of the effect of Vegfr inhibitor, SU5416, on permeability in transgenic reporter Tg(l-fabp:DBP-EGFP;kdrl:mCherry-caax) larvae. D-vitamin binding protein (DBP) expressed in hepatocytes (l-fabp promoter) served as an endogenous permeability biosensor (I). Extravasation of the DBP-EGFP protein from the permeable neurohypophyseal vascular cells (J) was measured in the area inside the hypophyseal capillary loop (dashed line in K). Larvae were treated with DMSO (K, n = 9) or SU5416 at 5 ?M (L, n = 13) between 4 and 5 dpf. Treatment with SU5416 led to reduced extravasation of DBP-EGFP from the hypophyseal loop (M, ?p < 0.05; Mann-Whitney test; for each treatment). A.U., arbitrary units. Scale bar: 5 ?m. Data are presented as mean � SEM (D, H, and M). See related Figures S4 and S5. |
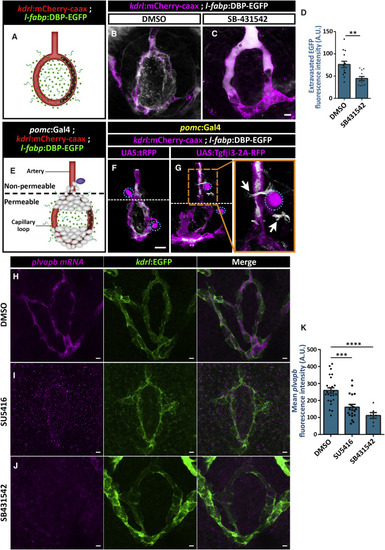
Tgf? and Vegf Signaling Increases Vascular Permeability and plvapb Expression (A?D) Measurement of hypophyseal permeability using the transgenic biosensor Tg(l-fabp:DBP-EGFP;kdrl:mCherry-caax) (A) was performed as described in Figure 4. Larvae were treated with either DMSO (B, n = 14) or TGF-? type I receptor inhibitor, SB431542 (C, n = 12), between 4 and 5 dpf, and extravasation of DBP-EGFP protein was quantified (D, ??p < 0.01; Mann-Whitney test). A.U., arbitrary units. Scale bar: 5 ?m. (E?G) The effect of Tgf?3 on permeability was determined using the triple transgenic system Tg(l-fabp:DBP-EGFP;kdrl:mCherry-caax;pomc:Gal4) (E). The pomc:Gal4 driver was used to generate local hypophyseal clones overexpressing either UAS:tRFP (F, n = 10) or UAS:tgf?3-2A-tRFP (G, n = 22), as described in Figure 4. Dashed lines mark the border between the permeable hypophyseal capillary and the non-permeable hypophyseal artery. Mosaic expression of Tgf?3 (G, dotted cell) near the non-permeable artery led to extravasation of DBP-EGFP (inset; white arrows), whereas tRFP expression did not induce that effect (F). Correlation between the co-occurrence of artery extravasation and Tgf?3 clones was determined by calculating the phi coefficient of association, followed by Fisher?s exact test of association (n = 8/22; p < 0.05) Scale bar: 10 ?m. (H?K) Measurement of in situ plvapb expression upon Vegf or Tgf signaling perturbation. Confocal z stack images showing fluorescent in situ hybridization (FISH) of transgenic larvae using probes directed against mRNAs of plvapb. Larvae were treated with either DMSO (H, n = 24), SU5416 (I, n = 19) or SB-431542 (J, n = 6) between 4 and 5 dpf, and plvapb fluorescent intensity was quantified (K, ????p < 0.0001; ???p < 0.001; one-way ANOVA). A.U., arbitrary units. Scale bar: 5 ?m. Data are presented as mean � SEM (D and K). See related Figures S4 and S5. |
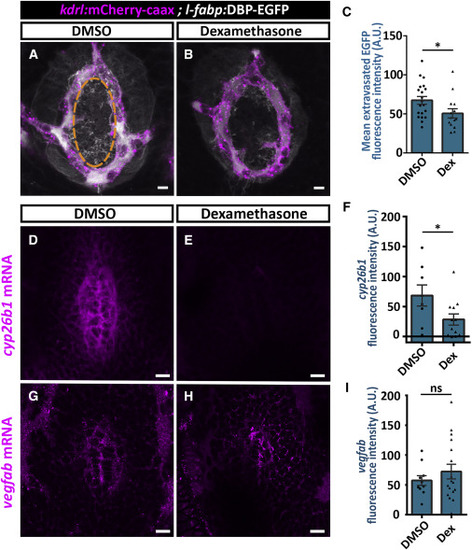
Dexamethasone Treatment Decreases Hypophyseal Permeability and cyp26b1 Expression (A?C) Measurement of hypophyseal permeability using the transgenic biosensor Tg(l-fabp:DBP-EGFP;kdrl:mCherry-caax) was performed as described in Figure 4. Larvae were treated with DMSO (A, n = 20) or dexamethasone at 100 ?M (B, n = 14) between 4 and 5 dpf. Dexamethasone treatment led to reduced extravasation of DBP-EGFP from the hypophyseal loop (C, ?p < 0.05; Student?s t test). A.U., arbitrary units. Scale bar: 5 ?m. (D?I) Measurement of in situ cyp26b1 and vegfab expression upon dexamethasone treatment. Confocal z stack images showing fluorescent in situ hybridization (FISH) of transgenic larvae using probes directed against cyp26b1 (D and E) or vegfab mRNAs (G and H). Larvae were treated with DMSO or dexamethasone at 100 ?M between 4 and 5 dpf, followed by FISH, and the ISH fluorescence in the neurohypophyseal area was quantified. Dexamethasone treatment led to reduced ISH fluorescence of cyp26b1 (E) but not of vegfab (H). (F; ?p < 0.05; Student?s t test; n = 8, 12 for each treatment. I; ns = not significant; n = 10, 17). A.U., arbitrary units. Scale bar: 10 ?m. Data are presented as mean � SEM (C, F, and I). See related Figures S5?S7. |
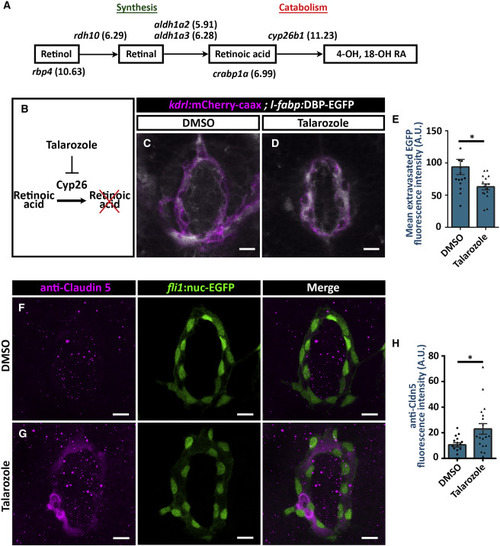
Cyp26 Promotes Hypophyseal Permeability by Repressing Claudin-5 Expression (A) Pituicytes are enriched with genes related with retinoic acid (RA) homeostasis. The genes encoding the proteins associated in each step of the RA homeostasis pathway are shown. Pituicytes can import blood-borne retinol reaching hypophysis and degrade it using Cyp26b1. The relative expression levels of the genes in pituicyte transcriptome are shown in brackets (log2FC units). (B?E) Talarozole inhibits the Cyp26b-mediated catabolism of retinoic acid (A). Measurement of hypophyseal permeability using the transgenic biosensor Tg(l-fabp:DBP-EGFP;kdrl:mCherry-caax) was performed as described in Figure 4. Larvae were treated with DMSO (C) or Cyp26 inhibitor Talarozole at 10 ?M (D) between 4 and 5 dpf, and extravasation of DBP-EGFP protein was quantified (E). Talarozole treatment led to reduced extravasation of DBP-EGFP from the hypophyseal loop (E; ?p < 0.05; Mann-Whitney test; n = 13, 16 for each treatment). A.U., arbitrary units. Scale bar: 10 ?m. (F?H) Measurement of tight junction Marker Claudin-5 (Cldn5) expression on immunohistochemistry using anti-Cldn5 in Tg(fli1:nuc-EGFP). Transgenic larvae were treated with DMSO (F) or talarozole at 10 ?M (G) between 4 and 5 dpf, followed by anti-Cldn5 immunostaining. Scale bar: 10 ?m. Talarozole treatment led to increased anti-Cldn5 immunofluorescence in the hypophyseal vascular loop (H; ?p < 0.05; Student?s t test; n = 16, 18 for each treatment). A.U., arbitrary units. Data are presented as mean � SEM (E and H). See related Figure S7. |
Reprinted from Developmental Cell, 47(6), Anbalagan, S., Gordon, L., Blechman, J., Matsuoka, R.L., Rajamannar, P., Wircer, E., Biran, J., Reuveny, A., Leshkowitz, D., Stainier, D.Y.R., Levkowitz, G., Pituicyte Cues Regulate the Development of Permeable Neuro-Vascular Interfaces, 711-726.e5, Copyright (2018) with permission from Elsevier. Full text @ Dev. Cell