
Fig. 3
- ID
- ZDB-IMAGE-190426-3
- Publication
- Anbalagan et al., 2018 - Pituicyte Cues Regulate the Development of Permeable Neuro-Vascular Interfaces
- All Figures
- Figures for Anbalagan et al., 2018
|
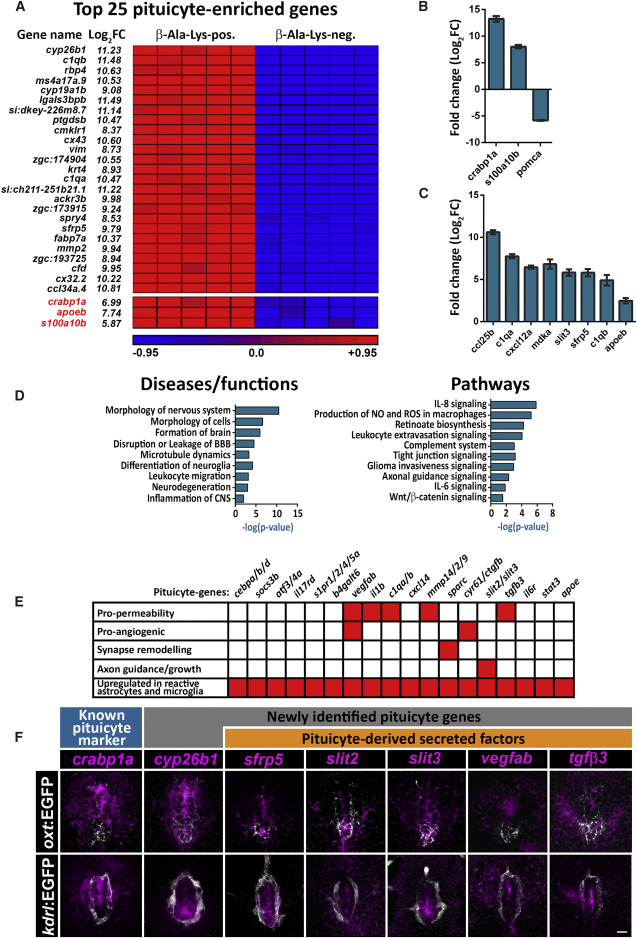
Fig. 3 Molecular Signature and Pathway Analyses of Adult Pituicytes (A) Heatmap showing normalized expression levels (red = high, blue = low) of the most highly enriched 25 pituicyte genes obtained by RNA-seq of FACS-sorted, β-Ala-Lys-Nɛ-AMCA-labeled cells from five independent pools (7 animals each) of dissected hypophyses. Genes whose expression was upregulated in the β-Ala-Lys-positive (pos.) versus β-Ala-Lys-negative (neg.) cell population are ordered by statistical significance (adjusted p value). The log2-fold change (log2FC) showing the extent of gene expression enrichment is indicated. Previously known pituicyte markers are highlighted in red at the bottom of the list. (B and C) Graph showing validation of the RNA-seq results by quantitative real-time PCR analyses of known pituicyte markers (B) and selected novel pituicyte-derived secreted factors. FACS-sorted β-Ala-Lys-Nɛ-AMCA-positive; pomc:EGFP-negative cells were compared to β-Ala-Lys-Nɛ-AMCA-negative populations (C) (see also Figure S2). Pituicyte markers crabp1a and s100a10b are highly upregulated in β-Ala-Lys-Nɛ-AMCA-positive; pomc:EGFP-negative population, whereas the adenohypophyseal marker pomca is downregulated, indicating a high degree of enrichment for pituicytes over other hypophyseal cell types. Error bars indicate SD. (D) Graph showing the top statistically enriched terms for the diseases, functions, and signaling pathways of pituicyte-enriched genes, as determined by Ingenuity Pathway Analysis (see also Table S3). The x axis represents the negative logarithmic (-log10) p value for each term. (E) Matrix of selected pituicyte-enriched genes and their associated function as reported in the literature. Red-colored boxes denote the function or upregulation of the gene in reactive astrocytes or microglia. As seen in the bottom line, most of the genes have previously been shown to be upregulated in reactive astrocytes or microglia. (F) Confocal z stack images showing fluorescent in situ hybridization (FISH) of transgenic larvae (5–8 dpf) using probes directed against mRNAs of known and selected novel pituicyte-specific genes, followed by anti-EGFP staining. The neurohypophyseal area in which either the axonal termini [Tg(oxt:EGFP), top] or capillary loop [Tg(kdrl:EGFP)] were labeled is shown. Scale bar: 5 μm.
Reprinted from Developmental Cell, 47(6), Anbalagan, S., Gordon, L., Blechman, J., Matsuoka, R.L., Rajamannar, P., Wircer, E., Biran, J., Reuveny, A., Leshkowitz, D., Stainier, D.Y.R., Levkowitz, G., Pituicyte Cues Regulate the Development of Permeable Neuro-Vascular Interfaces, 711-726.e5, Copyright (2018) with permission from Elsevier. Full text @ Dev. Cell