
- Title
-
Homotypic cell competition regulates proliferation and tiling of zebrafish pigment cells during colour pattern formation
- Authors
- Walderich, B., Singh, A.P., Mahalwar, P., N�sslein-Volhard, C.
- Source
- Full text @ Nat. Commun.
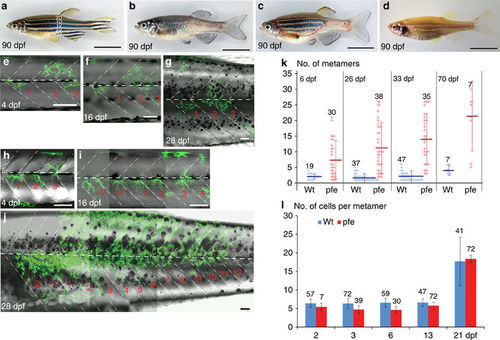
Development of xanthophore clusters in wild type and pfeffer. (a?d) Stripe pattern in 3-month-old (a) wild-type zebrafish, (b) pfeffer mutant, (c) chimera obtained by blastomere transplantation of wild type (Tg(pax7:GFP)) into pfeffer; the area with donor xanthophores is demarcated by a red dashed line and (d) control (albino). In (a) the dark stripes nomenclature is depicted along the dorsoventral axis. Developmental profile of Tg(pax7:GFP)-labelled wild-type xanthophores (green) in a (e?g) control and (h?j) pfeffer chimera. Dashed white lines?vertical and horizontal myosepta. Scale bars, a?d=1?cm; e?j=100??m. (k) Quantification of the number of metameres spanned by xanthophore clusters at larval stage (6?dpf) (wild type, n=19 clusters, 12 fishes; pfeffer, n=30 clusters, 18 fishes; P?0.0001); 26?dpf (wild type, n=37 clusters, 10 fishes; pfeffer, n=38 clusters, 17 fish; P?0.0001); 33?dpf (wild type, n=47 clusters, 10 fishes; pfeffer, n=35 clusters, 17 fishes; P<0.0001); 70?dpf (wild type, n=7 clusters, 4 fishes; pfeffer, n=7 clusters, 7 fishes; P=0.0077). The horizontal lines in dark blue (wild type) and red (pfeffer) indicate the mean value and the error bars represent standard deviation. We show that the differences between albino and pfeffer are significant at all time points investigated by using Student?s t-test (Welsh corrected). (l) Number of xanthophores per metamere in wild type (blue) and pfeffer transplants (red). Numbers of metameres analysed are depicted in the graph, error bars represent standard deviation. No significant differences between wild-type fish (blue) and pfeffer transplants (red) according to Student;s t-test (Welsh corrected) were found for 2?dpf: P=0.1795 and 21?dpf: P=0.6123. Overall 3?dpf (P=<0.0001), 6?dpf (P=<0,0001) and 13?dpf (P=0.0042) were shown to be significantly different. |
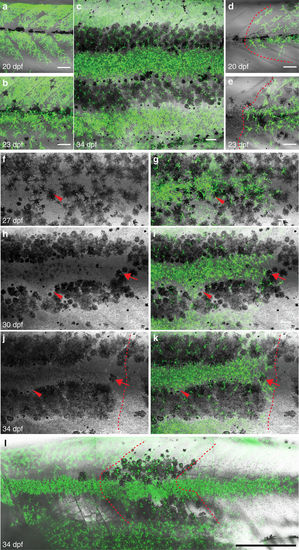
Local rescue of xanthophore numbers and organization by xanthophores in pfeffer hosts. (a?c) Restoration of normal number and organization of xanthophores in pfeffer. (d,e) Xanthophores spread into neighbouring xanthophore-devoid segments as coherent net. Dashed red line: border of transplanted cluster. (f?k) Restoration of the striped pattern by interactions between the xanthophore cluster and the host melanophores. (f?k) Widely distributed melanophores (black) become organized into stripes on increase in number of xanthophores and their compaction in the light stripe region. Red arrow: a cluster of melanophores that is cleared over time; red arrowhead: xanthophores retracting from dark stripe region. Dashed red line: border of the cluster showing xanthophores-positive area with rescued pattern on the left, no rescue on the right. (l) Chimera obtained by transplantation of Tg(pax7:GFP) into pfeffer;brass. The xanthophore cluster covers 17 metamers, whereas the melanophores cluster covers 4 metamers. Xanthophores?green, Tg(pax7:GFP). Dashed red line: border of melanophores cluster. Scale bars, a?k: 100??m, l: 250??m. |
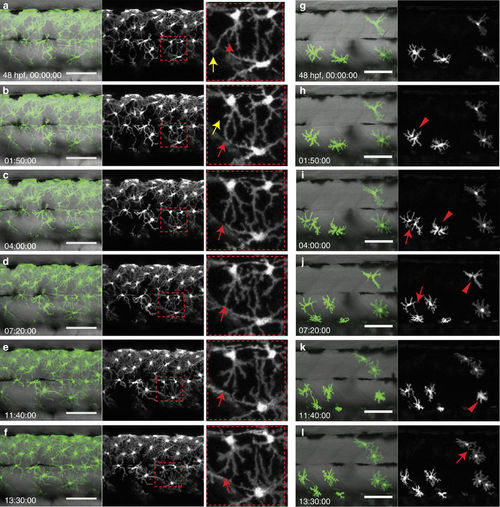
Interaction of xanthophores in larval stage. (a?f) Live-imaging of wild-type xanthophores?green; Tg(pax7:GFP), shows that cell numbers remain constant during larval development. (Same images in grey scale). Magnification of red dotted boxes: dynamic cell?cell contacts occur by extension (red arrows) and retraction (yellow arrows) of filopodia. (g?l) Live-imaging of xanthophores?green; Tg(pax7:GFP) in pfeffer chimera. Transplanted xanthophores divide, for better visibility same image in grey scale (red arrowheads) and extent filopodia to each other (red arrow). Scale bars, a?l: 100??m. |

Transplanted melanophore clusters in control (albino) and nacre chimeras. The organization of wild-type melanophores (black) in (a) albino and (c,d) nacre hosts. Adult nacre fish lacking melanophores (b). Scale bars, a?d: 250??m. (e) Quantification of the number of metamers occupied by wild-type melanophores in the body stripes in albino control (blue) and nacre (red) hosts. The number of clusters analysed is depicted in the graph. Student?s t-test (Welsh corrected) revealed significant differences between the size of wild type and nacre melanophore clusters at 28?dpf: (wild type, n=12 clusters, 7 fishes; nacre, n=25 clusters, 17 fishes, P?0.0002), at larval stages: (wild type, n=22 clusters, 10 fishes; nacre, n=14 clusters, 20 fishes, P=0.7892), 35?dpf: (wild type, n=10 clusters, 6 fishes; nacre, n=28 clusters, 17 fishes, P=0.2512 and adult (>90?dpf): (wild type, n=22 clusters, 9 fishes; nacre, n=20 clusters, 17 fishes, P=0.3840) no significant difference could be shown. Horizontal lines in dark blue (wild type) and red (nacre) indicate the mean value and the error bars represent standard deviation. Student?s t-test (Welsh corrected) was used to determine the P-value. |
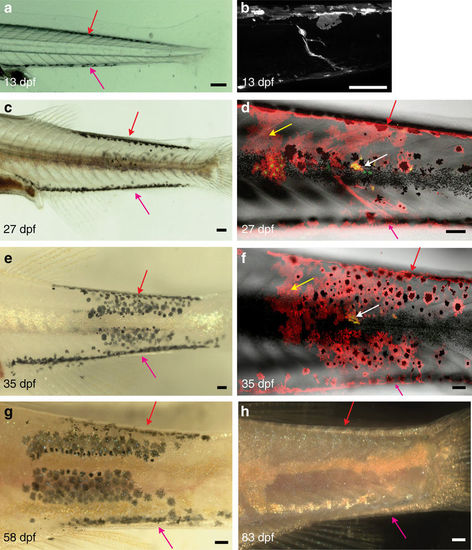
Behaviour of melanophore clusters in nacre host. Clusters of wild-type melanophores (Tg(TDL358:GFP; sox10:mRFP)) in nacre followed through metamorphosis by (a,c,e,g,h) bright-field microscopy and (b,d,f) confocal imaging. (a?h): Dorsal and ventral streaks of melanophores are visible (red and pink arrows). These melanophores gradually disappear. (e?g) On 13 and 27?dpf confocal microscopy shows a DRG labelled within the melanophore cluster. (b,d) Sox10:mRFP labels clusters of xanthophores (yellow arrows), (d,f) TDL358:GFP labels iridophores (white arrows). (e?g) The melanophore cluster extends over about six segments. (h) At 83?dpf these melanophores disappear completely leaving a ghost dark stripe pattern surrounded by light stripes. Green plus red: iridophores, red only: xanthophores, red plus black: melanophores. Scale bars, a?h: 100??m. |
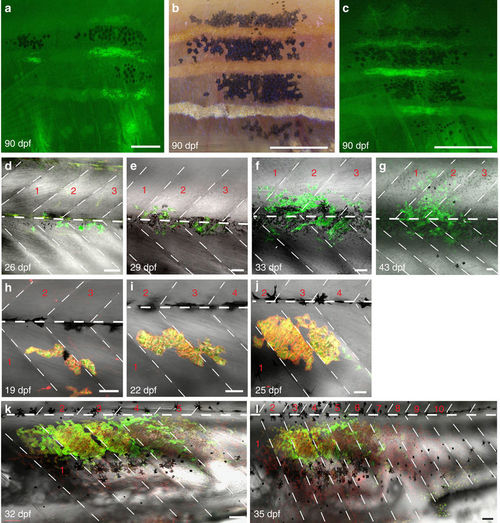
Behaviour of iridophores in control (albino) and iridophore-deficient (shady) hosts. (a?c) Iridophore and melanophores clusters (derived from Tg(�-act:GFP)) in control (albino) analysed with fluorescence (a,c) and bright-field microscopy (b): at 90?dpf iridophores and melanophores cover several stripes spanning between 1 and 4 metameres. (d?g) Confocal images of (Tg(TDL358:GFP))-labelled iridophore clusters in control (albino): iridophores appear in three adjacent metameres at 26?dpf and multiply within the same metameres. (h?l) (Tg(TDL358:GFP; sox10:mRFP)) cluster in shady covers 10 metameres at 35?dpf. Dashed white lines indicate vertical and horizontal myosepta. Red numbers indicate metameres. Scale bars, a?c: 250??m, d?l: 100??m. |
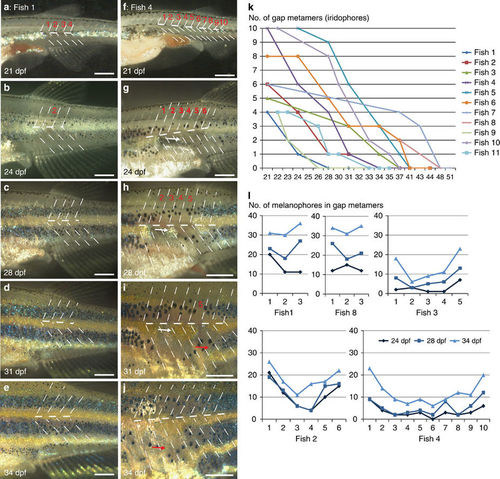
Regeneration of iridophores and melanophores after ErbB inhibition. Treatment with PD168393 during embryogenesis (see methods) results in (a?j) gaps of different sizes (1?12 metamers) in the striped pattern of metamorphosing fish. Overall 15 fishes carrying gaps between 3 and 12 metamers were imaged through metamorphosis. Red numbers (a?i) indicate the segments that are devoid of iridophores at the onset of bright-field imaging. Dashed lines indicate vertical and horizontal myosepta. On 24?dpf (g) a spot of regenerating iridophores appears in the middle of the gap and it expands laterally (white arrow in g,h,i). (k) Time (in days) taken to fill the gaps of variable sizes in the stripe pattern. (l) Increase in numbers of melanophores in individual fish (n=5) during regeneration of gap metamers at three different time points, 24, 28 and 34 ?dpf. Scale bars, a?j: 250??m. |
Behaviour of iridophores and melanophores during pattern regeneration after ErbB inhibition. (a?g) Confocal images of Tg(sox10:mRFP) animal developing with a gap (indicated by number 1?4) in the stripe pattern. Existing iridophores (yellow arrowheads) extend laterally into the prospective light stripe region that is devoid of iridophores and fill the region. New melanophores appear near the margins of the gap and locally restore the pattern. Occasionally, melanophores display short-scale movement (yellow arrows). Blue arrows: melanophores situated along the horizontal myoseptum that move dorsally to join dark stripes on regeneration of the light stripe by iridophores. Iridophores?red (Tg(sox10:mRFP). SL, standard length of fish. Scale bars,100??m. |

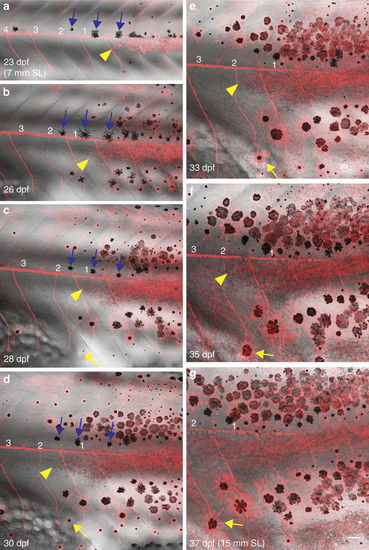
Iridophore disperse laterally to occupy iridophore-devoid regions. (a?c) Iridophores (white arrowheads, Tg(sox10:mRFP)) extend to the empty segment on the left and increase in number. (d?k) Gap closure in an animal lacking iridophores in six segments at 22?dpf (numbered 1?6). Red dashed lines indicate the original borders of the gap. Small arrows in d?h: larval melanophores remain stable within the gap. (e) Iridophores that are present outside the gap begin to invade the iridophore-devoid segments and within a day, iridophores can be seen in segment 1 and 6. (f?h) By lateral movement, iridophores recover in segments 1?3 and 5?6, only the segment 4 remains devoid of iridophores. (i) The first light stripe, X0 lacks iridophores in the segment 4 and remains interrupted. Corresponding region in the newly formed light stripe also lacks iridophores (red arrowheads). The dark stripe region does not develop sufficient melanophores and subsequently iridophores begin to migrate vertically (big red arrow) invading the dark stripe region. (j,k) Vertically migrating iridophores lead to interruption of the dark stripe region by the light stripe region. SL, standard length of fish. Scale bars,100??m. |

Xanthophore regeneration following drug-mediated ablation. (a?d): Larva at 5?dpf, xanthophores: green (Tg(pax7:GFP) and red: Tg(fms:Gal4, UAS:nfsB-mcherry). (e?h): The same region after ablation at 7?dpf: yellow arrow: (Tg(pax7:GFP) labels muscle tissue and their precursors24. (i?l): same region at 11?dpf. Red arrow: regenerated xanthophore. (a,e,i): merge; (b,f,j): (Tg(pax7:GFP) in grey scale; (c,g,k): Tg(fms:Gal4, UAS:nfsB-mcherry) in grey scale; (d,h,l): (Tg(pax7:GFP) in inverted grey scale. (m): Adult fish after ablation displaying a normal pattern. Scale bars, a?l: 100??m, m: 250??m. |
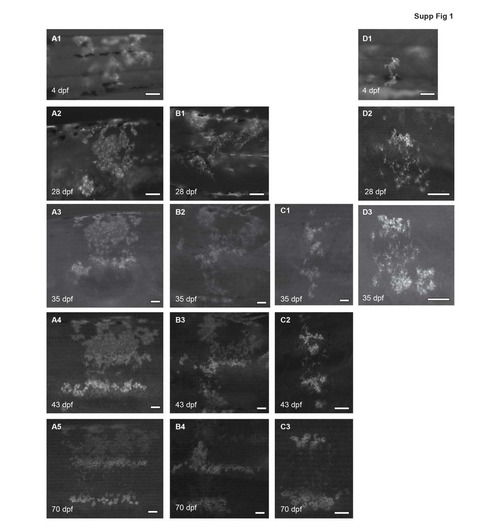
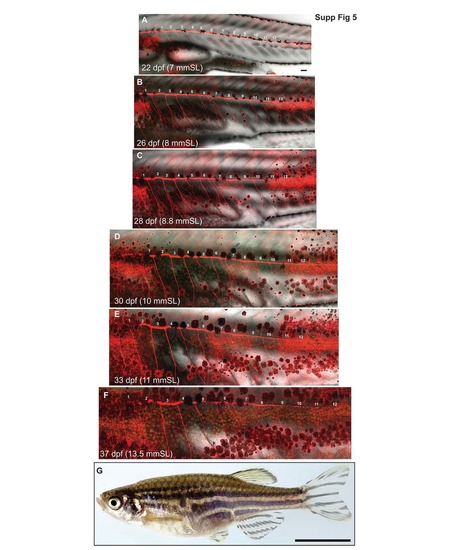
Examples showing development of xanthophore clusters in wild-type chimeras during metamorphosis. Xanthophore clusters stay restricted between 1 ? 4 metamers and contribute to several light and dark stripes along the dorsoventral axis, show small rearrangement until 70 dpf. Shape changes of xanthophores start to happen from the beginning of stripe formation (28 dpf), resulting in stellate and densely-organized cells in the dark and the light stripe regions, respectively. All images are acquired with a Leica M205FA microscope. Scale bars: 100 ?m |

Examples of melanophores clusters in wild-type chimeras on 90 dpf. (A) albino host (B,C) chimeras of wild-type and albino hosts. Clusters spread over 1 ? 4 metameres and may span the complete body, including the fins along the dorsoventral axis. (D?J) close ups of melanophore clusters in albino show that the black donor melanophores are scattered between colourless albino melanophores. Additionally melanophores do not always cover all dark stripes. All images are acquired with a Canon 5D Mk II camera. Scale bars A-C: 1 cm; D-J: 250 ?m. |

Examples of melanophores clusters in nacre chimeras. (A) nacre host (B?I) chimeras of wild-type (Tg(?Act:gfp) and nacre hosts. (B,C,F;G;I) Melanophore clusters appear at the dorsal side and in the scales (D,E,F,G,H,I) Host melanophores may populate all dark stripes from dorsal to ventral including fins, they may extend over 6 metamers. All pictures were taken with a Leica M205FA microscope and with a Canon 5D Mk II camera. Scale bars A: 1 cm, B?I: 250 ?m. |
Regeneration of a large gap stripe pattern caused by ErbB inhibition. (A-B) An eleven segment-wide gap in the first light stripe is filled initially be lateral movement of iridophores. (C-D) The new melanophores appear but in numbers lower than in the control segments. On 28 dpf in (C), an ectopic iridophore cluster is seen in the middle of the gap in segments numbered 7-8. (D-F) The iridophores from this new cluster begin to spread thus filling the gap completely on the right side (segments numbered 9-11) where melanophores also catch up in terms of numbers. Stripe pattern is restored in this region. On the left side of the gap (segments numbered 3-5), melanophores fail to appear in numbers comparable to that in the control regions and iridophores of abnormal morphology and organization appear. This region develops wavy stripes of abnormal width. Scale bar in A: 100 ?m. (G) Bright field image of the same fish at adult stage, the locally abnormal stripe organization can still be seen (Scale bar=1 cm). Genotype: Tg(sox10:mRFP). Green: xanthophore auto-fluorescence. SL: standard length of fish. |