Image
Figure Caption
Fig. 10
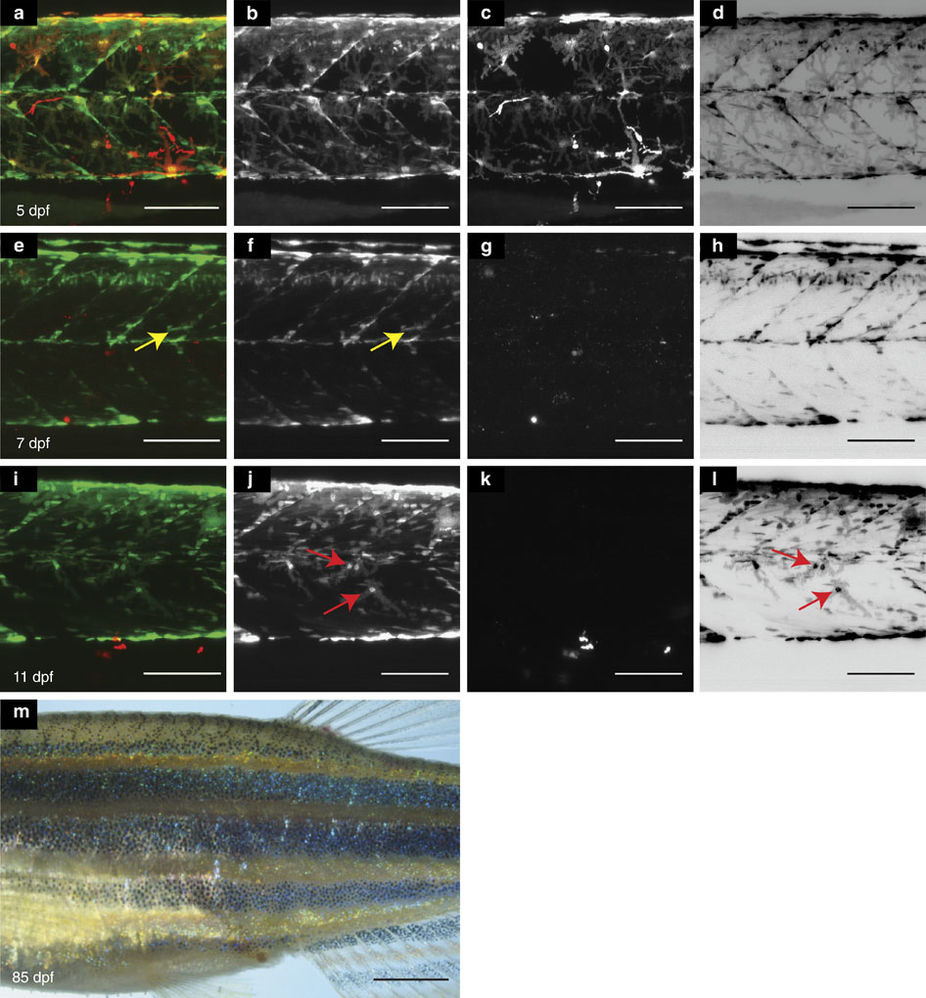
Xanthophore regeneration following drug-mediated ablation.
(a–d): Larva at 5 dpf, xanthophores: green (Tg(pax7:GFP) and red: Tg(fms:Gal4, UAS:nfsB-mcherry). (e–h): The same region after ablation at 7 dpf: yellow arrow: (Tg(pax7:GFP) labels muscle tissue and their precursors24. (i–l): same region at 11 dpf. Red arrow: regenerated xanthophore. (a,e,i): merge; (b,f,j): (Tg(pax7:GFP) in grey scale; (c,g,k): Tg(fms:Gal4, UAS:nfsB-mcherry) in grey scale; (d,h,l): (Tg(pax7:GFP) in inverted grey scale. (m): Adult fish after ablation displaying a normal pattern. Scale bars, a–l: 100 μm, m: 250 μm.
Acknowledgments
This image is the copyrighted work of the attributed author or publisher, and
ZFIN has permission only to display this image to its users.
Additional permissions should be obtained from the applicable author or publisher of the image.
Full text @ Nat. Commun.

