
- Title
-
Expanded progenitor populations, vitreo-retinal abnormalities, and Muller glial reactivity in the zebrafish leprechaun/patched2 retina
- Authors
- Bibliowicz, J., and Gross, J.M.
- Source
- Full text @ BMC Dev. Biol.
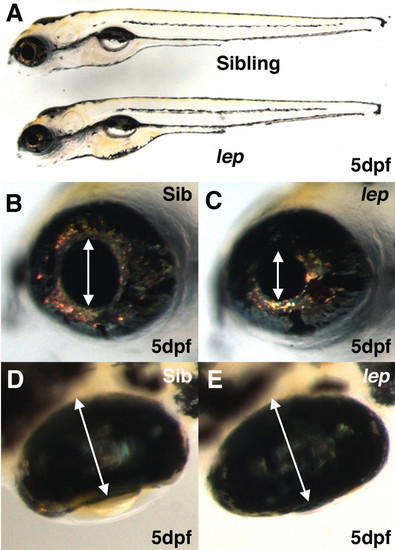
lep/ptc2 mutants possess enlarged retinas and reduced pupil size. Whole embryo lateral view shows that lep/ptc2 embryos are largely normal compared to their siblings (A). High magnification images of sibling (B) and lep/ptc2 (C) eyes reveal reduced pupil size in lep/ptc2 (arrows in B, C). Dorsal view images illustrate the overgrowth of retinal tissue as the retina is thicker and appears to engulf the lens (arrows in D, E). PHENOTYPE:
|
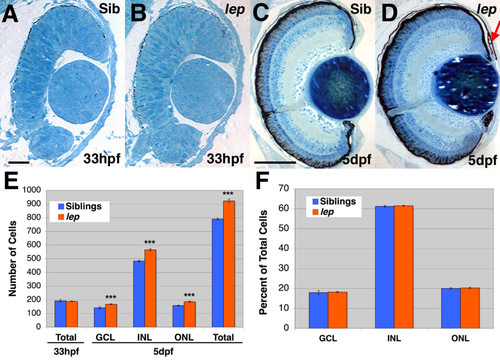
lep/ptc2 mutant retinas possess proportional increases in cell numbers in all three nuclear layers. Histology of sibling (A, C) and lep/ptc2 mutant (B, D) retinas at 33hpf (A, B) and 5dpf (C, D). E) Quantification of total number of retinal cells at 33hpf and 5dpf, and of cells in each nuclear layer at 5dpf (18.0%, 17.0%, and 17.8% increases in GCL, INL, and ONL, respectively. ***p < 0.0001). F) Graph of the proportion of each nuclear layer as a percentage of total retinal cells at 5dpf. Scale Bars = 20 μm in A, B and 100 μm in C, D. |
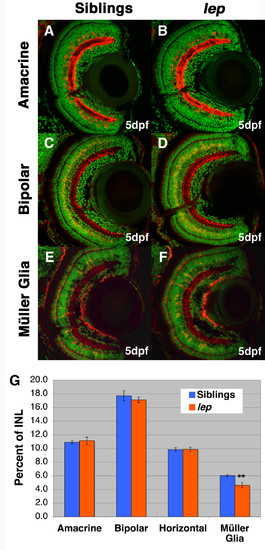
All neuronal cell types in the lep/ptc2 INL are increased proportionately, while Müller glia are reduced. Immunohistochemistry of sibling (A, C, E) and lep/ptc2 (B, D, F) retinas for Amacrine cells (A, B), Bipolar cells (C, D), and Müller glia (E, F). G) Cell counts for each INL cell type. No significant change is cell number in all neuronal cell types when calculated as a percentage of total INL cells. Müller glia, however, were reduced in lep/ptc2 retinas by 29% relative to sibling retinas (**p = 0.0013). PHENOTYPE:
|
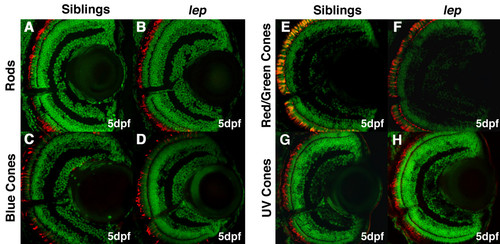
Photoreceptors appear unaffected in lep/ptc2 retinas. Immunohistochemical analysis of rods (A, B), blue cones (C, D), red/green cones (E, F), and UV cones (G, I) in sibling (A, C, E, G) and lep/ptc2 retinas (B, D, F, I). All photoreceptor types were present and appear normal. PHENOTYPE:
|
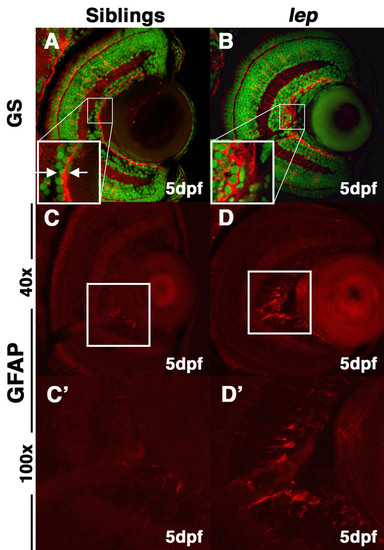
lep/ptc2 mutants display Müller glial reactivity and morphological abnormalities in the ILM. Immunohistochemical analysis using glutamine synthetase (GS) antibody, which marks differentiated Müller glia and their endfeet at the ILM, highlights disruptions in the ILM. (A) In sibling retinas, the ILM is tight and continuous (inset). (B) In lep/ptc2 retinas the ILM is discontinuous and Müller glial endfeet do not terminate properly at the ILM (inset). Glial fibrillary acidic protein (GFAP) antibody staining reveals elevated immuno-reactivity in the inner retina, adjacent to the optic nerve of lep/ptc2 (D and arrows in D′) mutant retinas as compared to siblings (C, C′). Approximately 40% of analyzed mutants displayed significant ILM disruptions and elevated GFAP levels. |
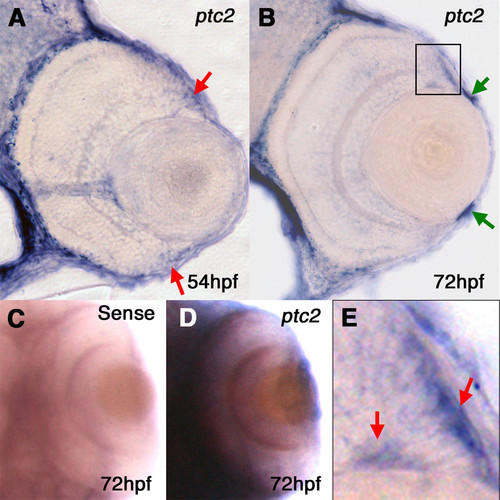
ptc2 is expressed at the zebrafish CMZ. In-situ hybridization for the ptc2 transcript shows expression at the retinal margin at 56hpf (arrows in A). At 72hpf, transcript is detected throughout the CMZ (B) and at the iridio-corneal angle (green arrows), with high magnification of CMZ region (E) revealing more robust staining adjacent to the RPE and in a region just apposed to the GCL (red arrows). Whole mount images from a dorsal view of sense (C) and anti-sense (D) probes in-situ hybridization show that staining is specific. EXPRESSION / LABELING:
|
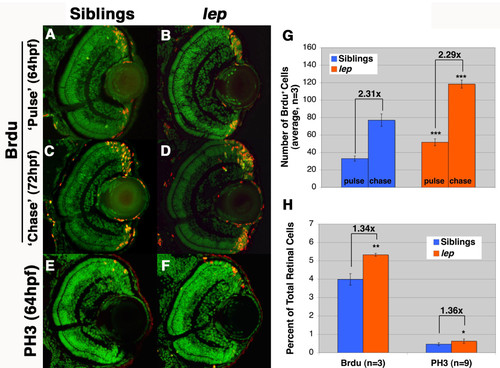
The number of proliferating CMZ progenitors is increased in lep/ptc2, while proliferation rate is unaffected. (A, B) BrdU ′pulse′ in sibling (A) and lep/ptc2 mutants (B). BrdU+ cells are observed throughout the CMZ. (C, D) After an 8 hour ′chase′, BrdU+ cells are observed at the CMZ, as well as within the retina of sibling (C) and lep/ptc2 mutants (D). E, F) PH3 labeling in sibling (E) and lep/ptc2 (F) at 64hpf. G) Quantification of BrdU+ cells in sibling and lep/ptc2 after ′pulse-chase′ experiment. lep/ptc2 retinas contained 67% more BrdU+ cells than sibling retinas at 64hpf. After an 8 hour ′chase′, the number of BrdU+ cells increased by almost identical ratios in siblings (2.31-fold increase) and lep/ptc2 mutants (2.29-fold increase, ***p < 0.0001). H) Quantification of BrdU- and PH3-positive cells as a percentage of total retinal cells in lep/ptc2 and wild-type siblings at 64hpf. The proportion of both BrdU+ and PH3+ cells increased by similar ratios (1.34-fold increase, **p < 0.001 and 1.36-fold increase, *p < 0.01, respectively). PHENOTYPE:
|
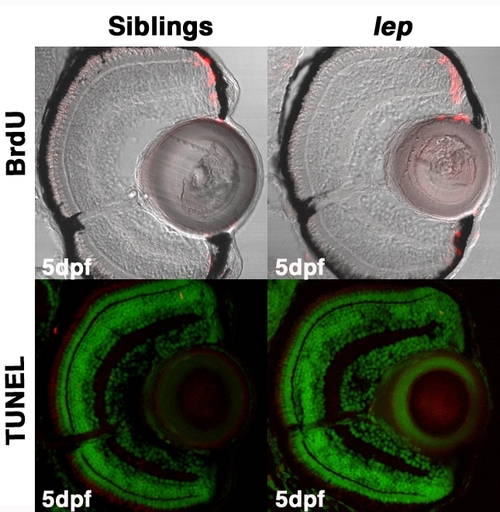
lep/ptc2 mutants do not possess ectopic cell death or proliferation in the central retina and/or optic stalk. (A, B) BrdU incorporation and (C, D) TUNEL assays in 5dpf (A, C) phenotypically wild-type siblings and (B, D) lep/ptc2 mutants. |