
Fig. 7
- ID
- ZDB-IMAGE-091214-7
- Publication
- Bibliowicz et al., 2009 - Expanded progenitor populations, vitreo-retinal abnormalities, and Muller glial reactivity in the zebrafish leprechaun/patched2 retina
- All Figures
- Figures for Bibliowicz et al., 2009
|
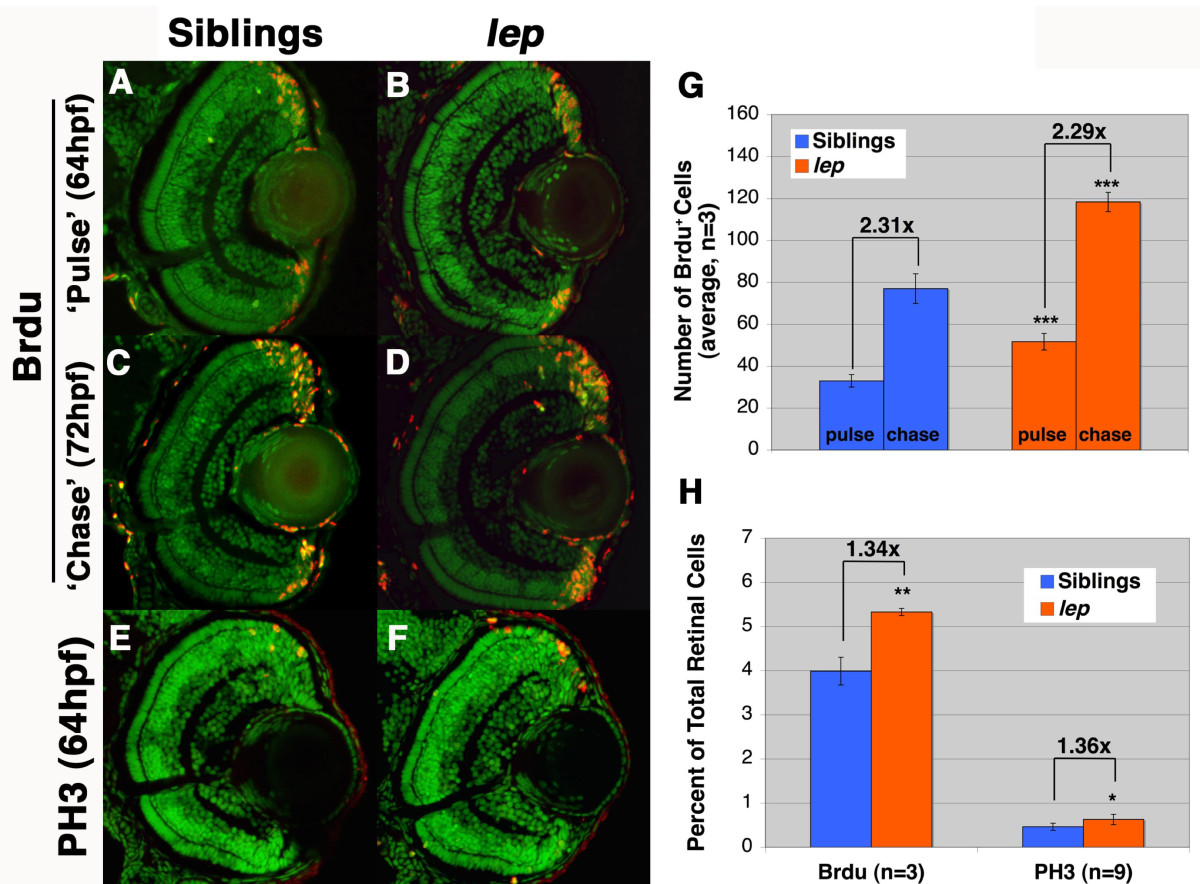
Fig. 7 The number of proliferating CMZ progenitors is increased in lep/ptc2, while proliferation rate is unaffected. (A, B) BrdU ′pulse′ in sibling (A) and lep/ptc2 mutants (B). BrdU+ cells are observed throughout the CMZ. (C, D) After an 8 hour ′chase′, BrdU+ cells are observed at the CMZ, as well as within the retina of sibling (C) and lep/ptc2 mutants (D). E, F) PH3 labeling in sibling (E) and lep/ptc2 (F) at 64hpf. G) Quantification of BrdU+ cells in sibling and lep/ptc2 after ′pulse-chase′ experiment. lep/ptc2 retinas contained 67% more BrdU+ cells than sibling retinas at 64hpf. After an 8 hour ′chase′, the number of BrdU+ cells increased by almost identical ratios in siblings (2.31-fold increase) and lep/ptc2 mutants (2.29-fold increase, ***p < 0.0001). H) Quantification of BrdU- and PH3-positive cells as a percentage of total retinal cells in lep/ptc2 and wild-type siblings at 64hpf. The proportion of both BrdU+ and PH3+ cells increased by similar ratios (1.34-fold increase, **p < 0.001 and 1.36-fold increase, *p < 0.01, respectively).