- Title
-
Fgf8 haploinsufficiency results in distinct craniofacial defects in adult zebrafish
- Authors
- Albertson, R.C., and Yelick, P.C.
- Source
- Full text @ Dev. Biol.
|
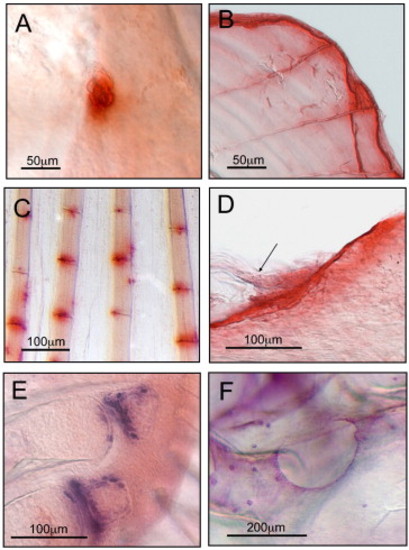
Fig. 1. Images of TRAP (A–D) and AP (E–F) staining in the adult zebrafish. TRAP activity was observed in osteoclasts (A), and in bony structures subjected to continuous growth and remodeling (B–D). An individual osteoclast cell is seen on the surface of the parietal bone (A). TRAP activity was often observed around the distal edges of scales (B). Fin ray joints from all five fins also stained for TRAP, although it was more frequently observed in pectoral and tail fins (pectoral fin, C). Panel D shows TRAP activity on the dorsal surface of the coronoid process of the dentary where the maxillary–mandibular ligament inserts (arrow, anterior is to the left). AP staining of osteoblast cells was observed at sites undergoing endochondral (E) and intramembranous (F) ossification. Endochondral ossification can be seen on pectoral fin radials 4 and 5 (E, dorsal is up). Intramembranous ossification was observed in the lateral line canal on the frontal bone (F, anterior is to the left). |
|
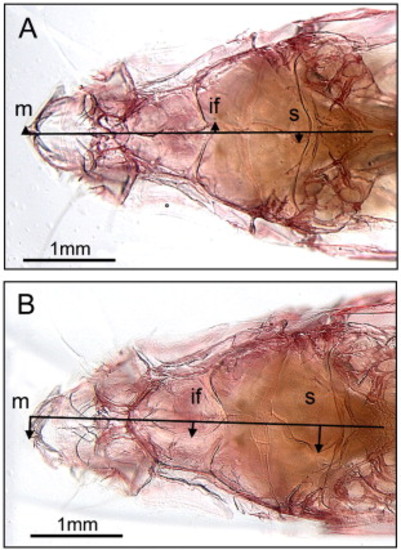
Fig. 2. Mandibular symmetry and cranial suture patterning is altered in aceti282a/+ zebrafish. The cranial midline was defined as the midline of the neurocranium. In homozygous wild-type zebrafish, the mandibular symphysis (m) was oriented along the cranial midline (A). In aceti282a/+ animals, however, the mandible exhibited pronounced asymmetry (B). The interfrontal (if) and sagittal (s) sutures in aceti282a/+ zebrafish also deviated significantly from the midline compared to wild-type siblings (F-ratio = 20.8, p < 0.0001, and F-ratio = 8.36, p = 0.006, respectively). PHENOTYPE:
|
|
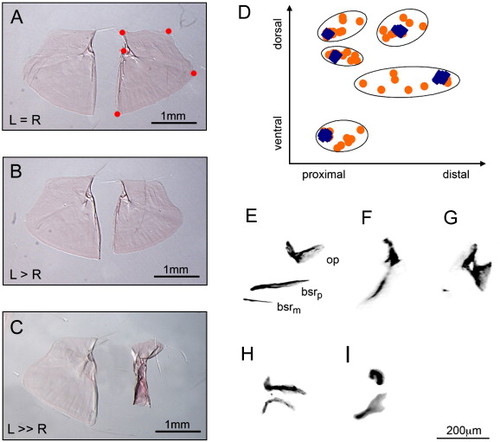
Fig. 3. Aceti282a/+ zebrafish exhibit asymmetry in opercle size and defects in opercle shape. Opercle size was defined as the square root of the sum of squared distances of the five landmarks depicted in panel A and their centoid (e.g., centroid size). Most mutants possessed left and right opercles that were equivalent in size (A). 28%, however, expressed a pronounced asymmetry in opercle size, with the left side typically larger than the right (B, C). Defective opercle shape in aceti282a heterozygous zebrafish mainly affected the width of the opercle (D). Wild-type landmark configurations are depicted as blue diamonds, and aceti282a/+ configurations are orange circles. Landmarks are the same as in panel A. Very little landmark variation was observed in wild-type zebrafish. Heterozygous animals on the other hand exhibited much greater landmark variation, especially along the proximal–distal axis. Opercle defects in aceti282a heterozygotes were distinct from those in aceti282a homozygous recessive mutants (E–I). The wild-type configuration of bones from the hyoid arch is shown in the 7 dpf larvae (E). Elements are arranged along the dorsal–ventral (DV) axis with the medial branchiostegal ray (bsrm) positioned ventrally, the opercle (op) positioned dorsally, and the posterior branchiostegal ray (bsrp) positioned in the middle. Nearly all aceti282a mutants were missing the ventral-most branchiostegal ray (bsrm) and the other two elements were small and misshaped (n = 194). However, a percentage of mutant larvae (∼ 10%) exhibited a range of bone morphologies possibly related to defects in DV patterning of the hyoid arch (F–I); these included fused opercle and branchiostegal rays (F), “opercle-gain” phenotypes (Kimmel et al., 2003) (G), and homeotic transformations of the opercle to a branchiostegal ray (H) and visa versa (I). PHENOTYPE:
|
|
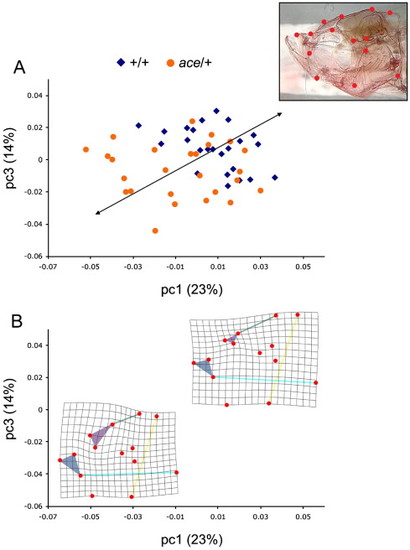
Fig. 4. Aceti282a/+ zebrafish exhibit aberrant craniofacial geometry. A relative warp analysis revealed two principal component axes that discriminate aceti282a/+ zebrafish from their wild-type siblings (A). The inset illustrates the position of fourteen landmarks used to describe the craniofacial skeleton in the lateral view. (B), Deformation grids as a function of the axes that differentiate aceti282a/+ and +/+ individuals. Aceti282a/+ animals exhibited an expanded frontal region of the skull (purple triangle), relative to the length of the posterior region of the cranium (green line). Aceti282a/+ zebrafish also exhibited coordinated changes in the configuration of the upper jaws (blue triangle), and in the relative height of the skull (yellow line). |
|
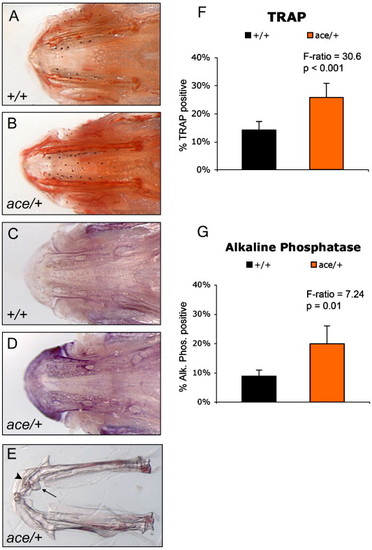
Fig. 5. TRAP and AP activity is elevated in the jaws of aceti282a/+ zebrafish. A greater proportion of the lower jaw was TRAP positive in aceti282a/+ animals relative to homozygous wild-types siblings (A, B, F, F-ratio = 30.6, p < 0.001). Aceti282a/+ zebrafish also exhibited greater AP actively, localized to the anterior portion of the low jaw (C, D, G, F-ratio = 7.24, p = 0.01). The higher levels of both TRAP and AP activity observed in the mandibles of aceti282a/+ zebrafish are consistent with the occurrence of aberrant and ectopic bone formation (arrowhead and arrow, respectively, in panel E). PHENOTYPE:
|
|
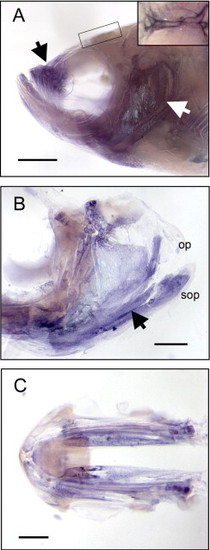
Fig. 6. Fgf8 mRNA is expressed in distinct anatomical regions of the mature craniofacial skeleton. (A) A 6-month-old wild-type zebrafish head showing fgf8 expression in the upper jaw apparatus (black arrow), operculum (white arrow), and sagittal suture (inset). Scale bar equals 1 mm. (B) The dissected operculum shows fgf8 expression throughout the subopercle (sop) and along the proximal–distal surface of the opercle (op) (black arrow). Scale bar = 500 μm. (C) Expression of fgf8 is also observed along the ventral surface of the mandible. Scale bar = 500 μm. EXPRESSION / LABELING:
|
Reprinted from Developmental Biology, 306(2), Albertson, R.C., and Yelick, P.C., Fgf8 haploinsufficiency results in distinct craniofacial defects in adult zebrafish, 505-515, Copyright (2007) with permission from Elsevier. Full text @ Dev. Biol.

