
Fig. 6
- ID
- ZDB-IMAGE-260731-34
- Genes
- Publication
- Li et al., 2026 - The accumulation of methylglyoxal and acrolein impairs arginine homeostasis causing hyperglycemia and renal abnormalities in male zebrafish
- All Figures
- Figures for Li et al., 2026
|
Fig. 6
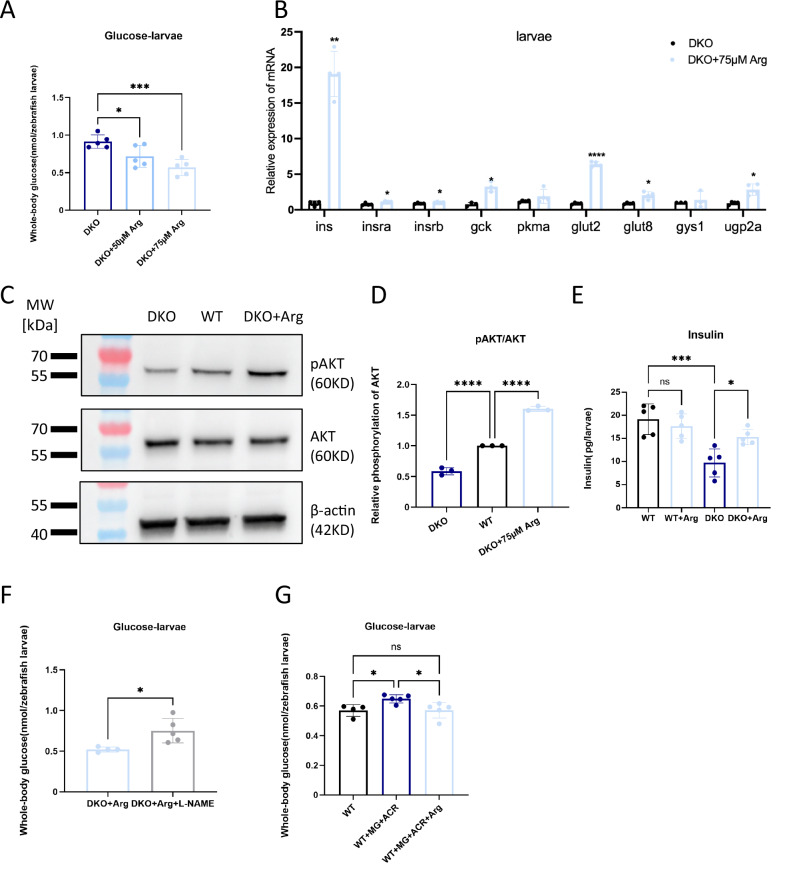
Arginine supplementation attenuated glucose levels in GLO1/AKR1A1A DKO larvae and larvae co-treated with MG and ACR.
A Arginine supplementation reversed the glucose elevation in GLO1/AKR1A1A DKO larvae. n = 5 biological replicates per group. Exact p values for each comparation are: DKO vs. DKO + 50 µM Arg, p = 0.037; DKO vs. DKO + 75 µM Arg, p = 0.001. Arg, L-arginine. B Arginine supplementation significantly upregulated the mRNA expression levels of ins, insra, insrb, and genes related to glucose transport, glycolysis and glycogenesis. n = 3/4 biological replicates per group. mRNA expression levels were quantified by RT-qPCR and normalized to arnt 2. Exact p values for each comparation are: ins, p = 0.0013; insra, p = 0.0172; insrb, p = 0.0269; gck, p = 0.0200; pkma, p = 0.2491; glut2, p < 0.0001; glut8, p = 0.0189; gys1, p = 0.6129; ugp2a, p = 0.0164. ins, insulin; insra, insulin receptor a; insrb, insulin receptor b; gck, glucokinase; pkmb, pyruvate kinase M1/2b; glut2, glucose transporter 2; glut8, glucose transporter 8; gys1, glycogen synthase 1; ugp2a, UDP-glucose pyrophosphorylase 2a; arnt2, aryl hydrocarbon receptor nuclear translocator 2. C,D Representative Western blotting images (C) and quantification (D) demonstrated decreased phosphorylated AKT level in DKO larvae, with arginine supplementation restoring AKT phosphorylation at 96hpf. n = 3 biological replicates per group. Exact p values for each comparation are: WT vs. DKO, WT vs. DKO + 75 µM Arg, p < 0.0001. hpf, hours of post fertilization. E Reduced insulin in DKO larvae at 96hpf which could be rescued after arginine supplementation. The samples were analyzed by an ELISA. n = 5 biological replicates per group. Exact p values for each comparation are: WT vs. DKO, p = 0.0003; DKO vs. DKO+Arg, p = 0.0248. F L-NAME increased glucose levels in GLO1/AKR1A1A DKO larvae treated with arginine through inhibition of NOS. n = 4/5 biological replicates per group. Exact p values for each comparation are: p = 0.0159. L-NAME, N(ω)-nitro-L-arginine methyl ester; NOS, nitric oxide synthase. G Arginine supplementation lowered the hyperglycemia induced by the co-treatment with MG and ACR. n = 4/5 biological replicates per group. Exact p values for each comparation are: WT vs. WT + MG + ACR, p = 0.0407; WT + MG + ACR vs. WT + MG + ACR+Arg, p = 0.0336. The bars indicate mean ± SD values. Statistical analysis were performed by one-way ANOVA and a two-tailed Student’s t-test. ns, not significant, *p < 0.05, **p < 0.01, ***p < 0.001, ****p < 0.0001. Source data are provided as a Source Data file.