
FIGURE 8
- ID
- ZDB-IMAGE-251216-14
- Genes
- Publication
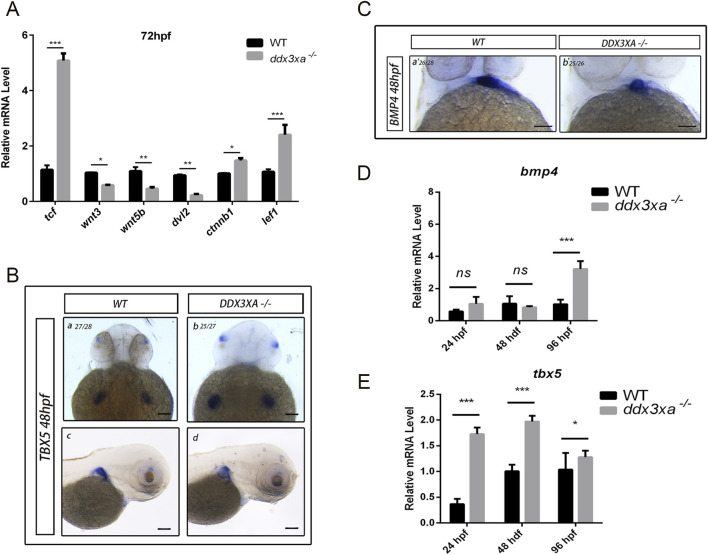
- Chen et al., 2025 - Ddx3xa mutations drive cardiac defects in a zebrafish model via dysregulation of wnt/β-catenin signaling
- All Figures
- Figures for Chen et al., 2025
|
FIGURE 8
Wnt signaling disruption in