
Fig. 2
|
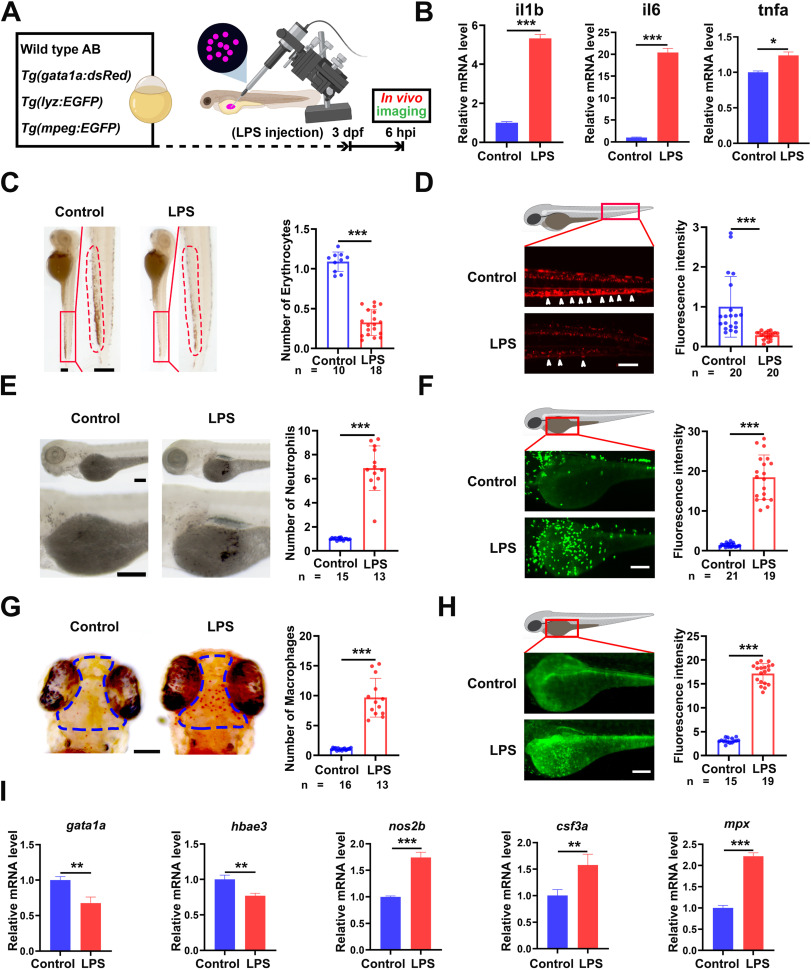
Fig. 2 Acute LPS treatment leads to a bias in erythroid-myeloid hematopoietic differentiation. (A) Schematic of the zebrafish experimental design, detailing procedures, groupings, and imaging techniques. (B) Relative mRNA levels of inflammatory markers. (C) O-dianisidine staining for erythroid cells in the caudal hematopoietic tissue (CHT) and their quantification. (D) Fluorescence in CHT of Tg(gata1a:DsRed) transgenic zebrafish and their quantification. (E) Sudan Black staining for neutrophils in the yolk sac and their quantification. (F) Fluorescence in the yolk sac of Tg(lyz:EGFP) transgenic zebrafish and their quantification. (G) Neutral red staining for macrophages in larvae heads and their quantification. (H) Fluorescence in the yolk sac of Tg(mpeg1:EGFP) transgenic zebrafish and their quantification. (I) mRNA expression analysis of erythroid and myeloid differentiation markers. In C-H, n = replicates per group. ∗P < 0.05, ∗∗P < 0.01, ∗∗∗P < 0.001.