
IMAGE
FIGURE 5
Image
|
Figure Caption
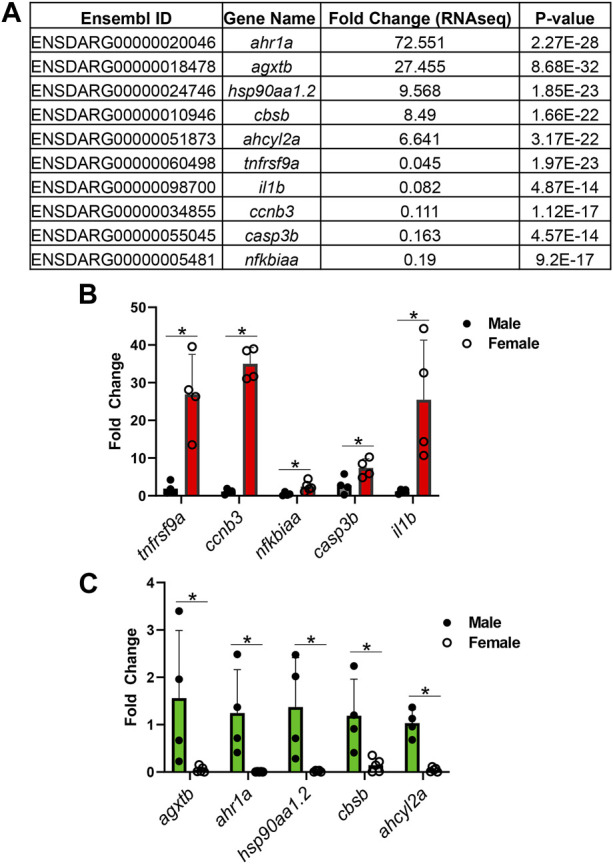
FIGURE 5
Sexually dimorphic genes from RNAseq analysis are validated by qPCR. (A) Table of top 10 genes and fold changes from RNAseq analysis. (B) qPCR validation of genes that were downregulated in male kidneys. (C) qPCR validation of genes that were upregulated in male kidneys. Four kidneys from male and female zebrafish were scored, respectively. *: p < 0.05.
Figure Data
Acknowledgments
This image is the copyrighted work of the attributed author or publisher, and
ZFIN has permission only to display this image to its users.
Additional permissions should be obtained from the applicable author or publisher of the image.
Full text @ Front. Physiol.