
Fig. 6
|
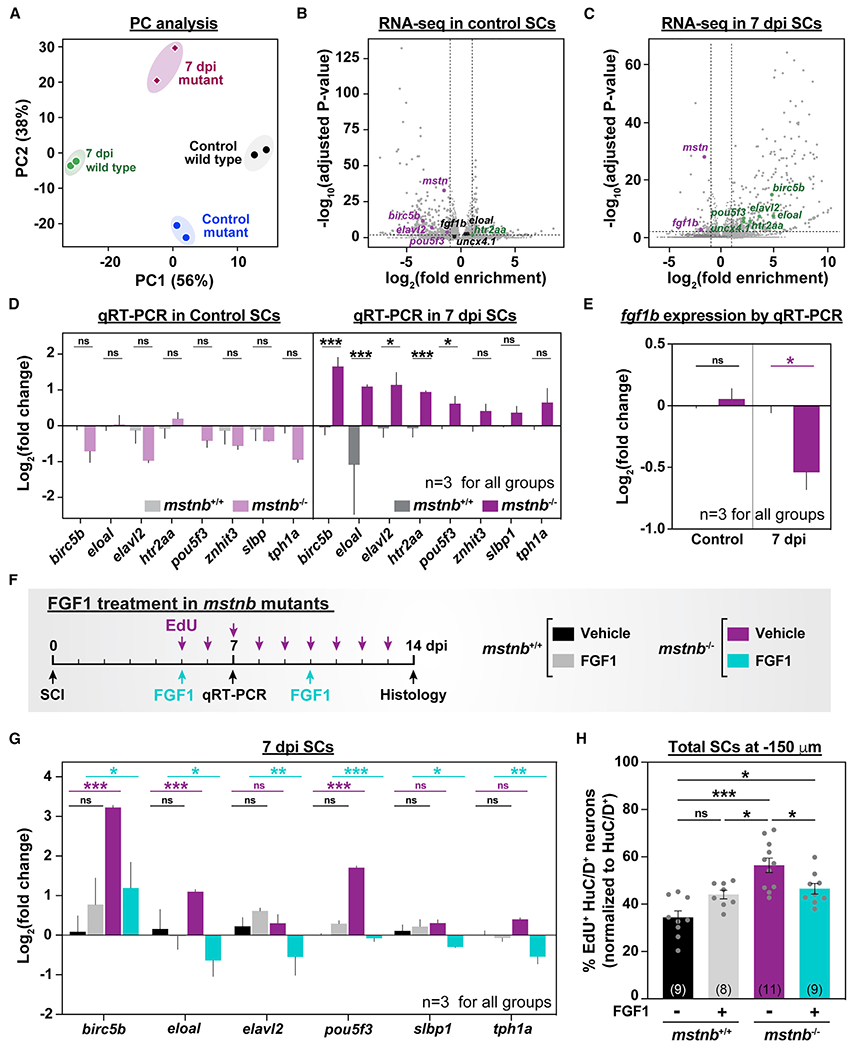
Fig. 6
(A) mstnb−/− and wild-type siblings were subjected to complete SC transections and collected at 7 dpi for RNA-seq. Control SC tissues were collected from uninjured fish. Sequencing was performed in independent duplicates from separate fish clutches. Principal-component analysis shows clustering of biological replicates. Principal components 1 and 2 (PC1 and PC2, respectively) show 56% and 38% variance, respectively.
(B and C) Volcano plot representation of genes that are significantly upregulated or downregulated in mstnb−/− SCs relative to wild-type controls. Upregulated genes include genes with log2(fold enrichment) > 1 and adjusted p < 0.01. Downregulated genes include transcripts with log2(fold enrichment) < −1 and adjusted p < 0.01. Selected upregulated (green) and downregulated (magenta) neuronal genes are indicated. Unchanged genes are labeled in black.
(D) qRT-PCR for neuronal genes was performed on mstnb−/− and wild-type SCs at 7 dpi. Uninjured mstnb−/− and wild-type controls were used. For each time point, log2(fold change) was normalized to eif1α and to gene expression levels in mstnb+/+ controls.
(E) fgf1b qRT-PCR was performed on uninjured and injured mstnb−/− and wild-type animals. For each time point, fgf1b expression was normalized to eif1α as a loading control and to fgf1b levels in mstnb+/+ controls.
(F) Experimental timeline for human recombinant FGF1 treatment in mstnb−/− animals.
(G) Neuronal gene expression was analyzed by qRT-PCR from FGF1- and vehicle-treated SC tissues at 7 dpi. For each gene, log2(fold change) was normalized to eif1α as a loading control and to gene expression levels in uninjured mstnb+/+ SCs.
(H) HuC/D and EdU staining was performed on vehicle- and FGF1-treated mstnb−/− and wild-type animals. The numbers of regenerating HuC/D>+ EdU>+ neurons were quantified in SC cross sections 150 μm rostral to the lesion site. The proportions of HuC/D>+ EdU>+ neurons (%) were normalized to the numbers of HuC/D>+ neurons for each section.
Dots represent individual animals from 2 independent clutches. Error bars depict SEM, and statistical significance was determined by one-way ANOVA. Multiple-comparisons p values are shown. ***p < 0.001; **p < 0.01; *p < 0.05; ns, p > 0.05.