
Fig. 3
- ID
- ZDB-IMAGE-221218-4
- Genes
- Publication
- Xia et al., 2022 - Activation of a transient progenitor state in the epicardium is required for zebrafish heart regeneration
- All Figures
- Figures for Xia et al., 2022
|
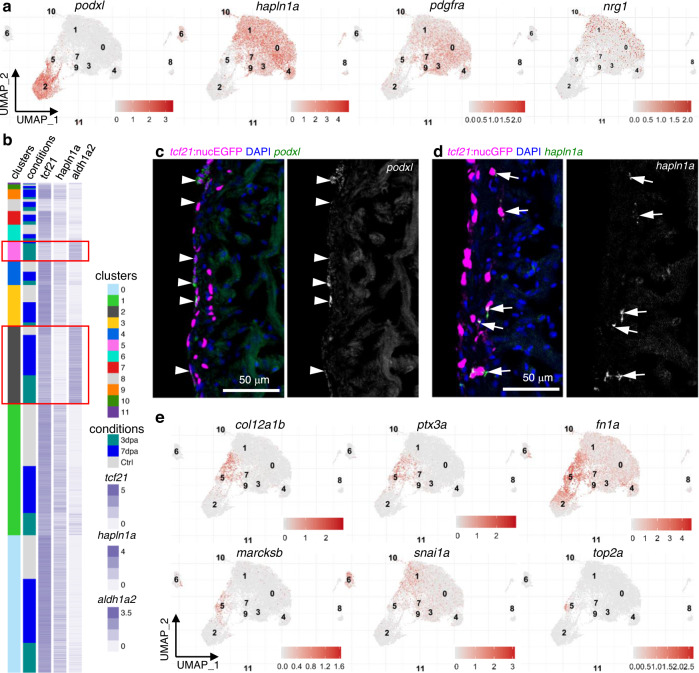
Fig. 3 a Normalized expression of marker genes on UMAPs (3 samples combined). b Heatmap of 3 marker genes: tcf21, aldh1a2, and hapln1a. Normalized expression values are shown; cells were sorted by cluster membership. Clusters 2 and 5 are highlighted in red frames. c Images of a 3 dpa heart section showing the ventricular wall with tcf21:nucEGFP in magenta and HCR staining of podxl in green. Nuclei were stained with DAPI (blue). A single-channel image of podxl is shown in grayscale on the right. Arrows indicate representative EGFP+podxl+ cells. Scale bar, 50 μm. d Images of a 3 dpa heart section showing the ventricular wall with tcf21:nucEGFP in magenta and HCR staining of hapln1a in green. Nuclei were stained with DAPI (blue). A single-channel image of hapln1a is shown in grayscale on the right. Arrows indicate representative EGFP+hapln1a+ cells. Scale bar, 50 μm. e Normalized expression levels of marker genes for the 3 dpa-specific cluster on UMAPs (3 samples combined).