
Figure 6
- ID
- ZDB-IMAGE-221211-196
- Genes
- Publication
- Gebuijs et al., 2022 - Targeting fibroblast growth factor receptors causes severe craniofacial malformations in zebrafish larvae
- All Figures
- Figures for Gebuijs et al., 2022
|
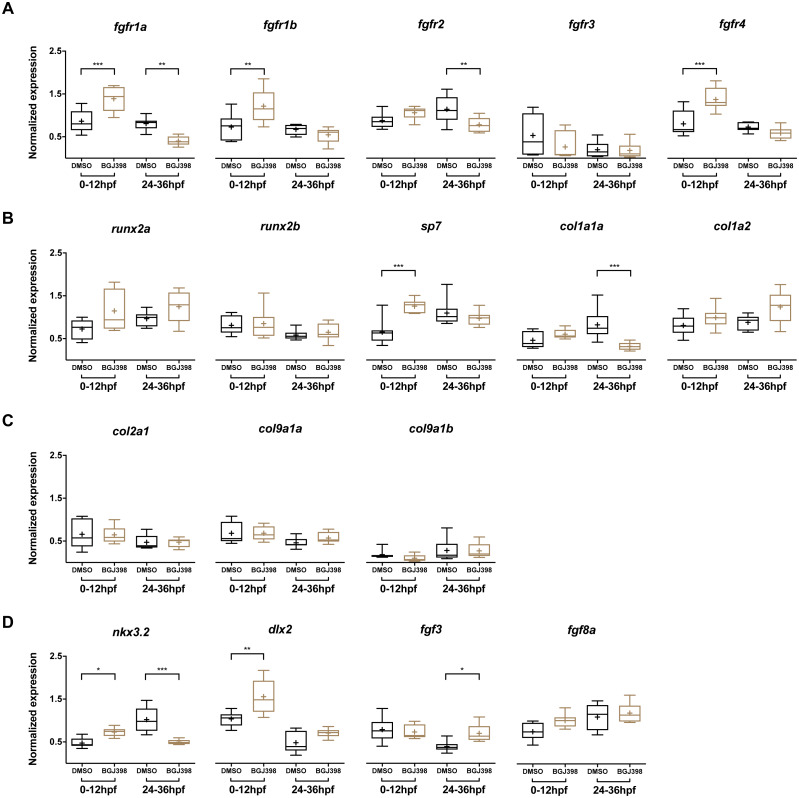
Figure 6
Exposure windows were 0–12 and 24–36 hpf. Exposed fish (n = 8) were compared to a DMSO control (n = 8, final concentration 0.1%). (A) Expression of fgfr s showing differential expression in fgfr1a, fgfr1b, fgfr2 and fgfr4. (B) Expression of genes involved in bone formation. (C) Genes involved in cartilage formation. From col9a1b one outlier (p < 0.01 in Grubbs’ test) was removed. (D) Neural crest cell marker genes. All data are presented as box plots, with median represented by a line within the box; interquartile ranges by the boxes, 5–95 confidence intervals by whiskers and means indicated by “+” symbol. All the data were analyzed using a Kruskal–Wallis test followed by a Dunn’s multiple comparison test. Asterisks indicate significant differences; ∗p < 0.05, ∗∗p < 0.01, ∗∗∗p < 0.001.