
Figure 3
- ID
- ZDB-IMAGE-221211-191
- Genes
- Publication
- Gebuijs et al., 2022 - Targeting fibroblast growth factor receptors causes severe craniofacial malformations in zebrafish larvae
- All Figures
- Figures for Gebuijs et al., 2022
|
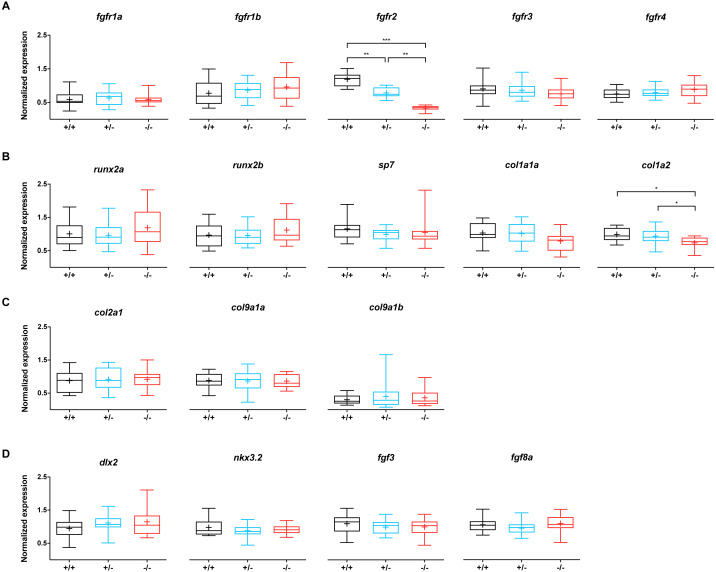
Figure 3
(A) Expression of fgfr s reveals that fgfr2 is downregulated in our mutants. (B) Expression of genes involved in bone formation. (C) Genes involved in cartilage formation were not significantly different among groups. (D) Neural crest cell marker genes. In the box plots the median is represented by the line within the box; the box shows interquartile ranges. Whiskers are drawn down to the 5th and up to the 95th percentile. Points below and above the whiskers are drawn as individual dots. The mean is indicated by a “+” symbol. All the data were analyzed using a Kruskal–Wallis test followed by a Dunn’s multiple comparison test. Asterisks indicate significant differences; ∗p < 0.05, ∗∗p < 0.01, ∗∗∗p < 0.001.