
IMAGE
Figure 7
- ID
- ZDB-IMAGE-220827-22
- Genes
- Publication
- Crouzier et al., 2022 - Morphological, behavioral and cellular analyses revealed different phenotypes in Wolfram syndrome wfs1a and wfs1b zebrafish mutant lines
- All Figures
- Figures for Crouzier et al., 2022
Image
|
Figure Caption
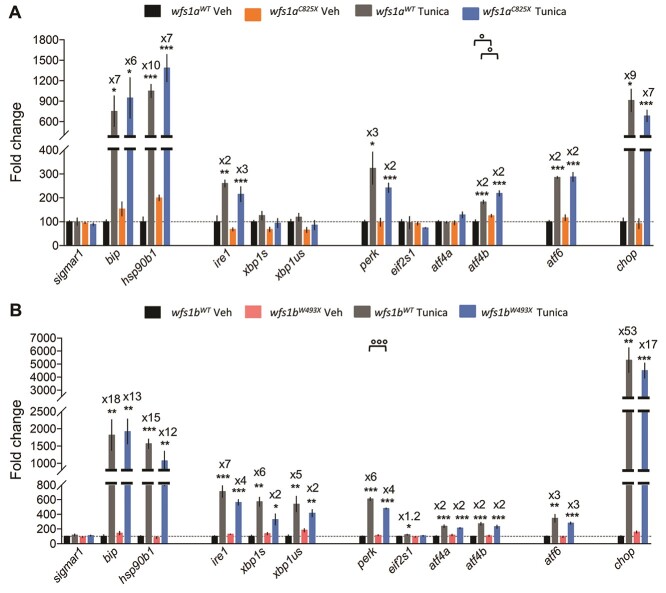
Figure 7
Relative gene expression levels of ER stress factors in zebrafish larvae at 5 dpf exposed to tunicamycin during 24 h. Expression analysis of the selected genes using cDNA prepared from
Figure Data
Acknowledgments
This image is the copyrighted work of the attributed author or publisher, and
ZFIN has permission only to display this image to its users.
Additional permissions should be obtained from the applicable author or publisher of the image.
Full text @ Hum. Mol. Genet.