
IMAGE
Fig. 3
Image
|
Figure Caption
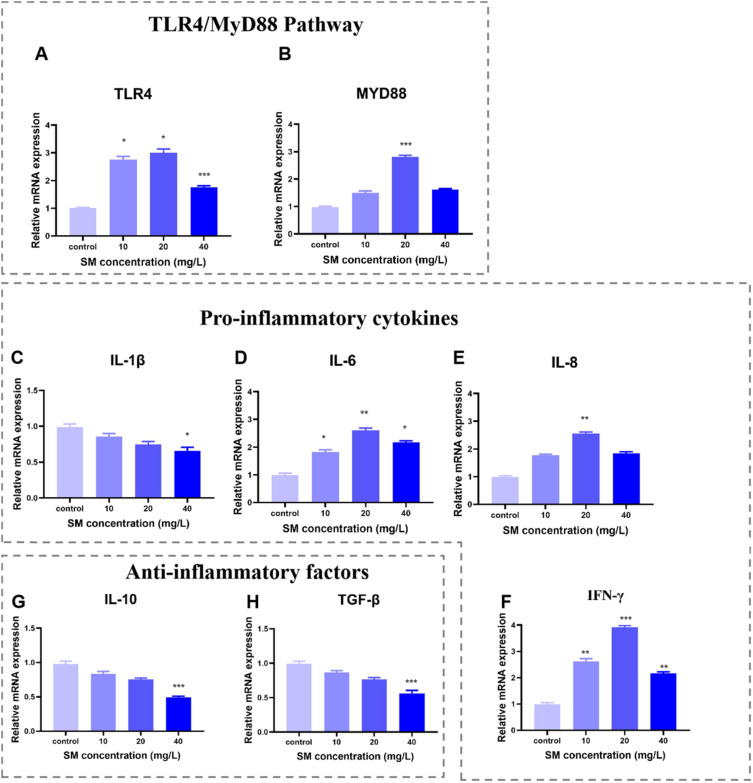
Fig. 3 Changes in the mRNA expression of immune-related genes after SM exposure. (A) TLR4; (B) MYD88; (C) IL-1β; (D) IL-6; (E) IL-8; (F) IFN-γ; (G) IL-10; (H) TGF-β. Experiments were performed in triplicate and data is presented as mean ± S.D. (n = 3). Asterisks (*P < 0.05, **P < 0.01, ***P < 0.001) denote significant differences between the control and exposure groups.
Figure Data
Acknowledgments
This image is the copyrighted work of the attributed author or publisher, and
ZFIN has permission only to display this image to its users.
Additional permissions should be obtained from the applicable author or publisher of the image.
Full text @ Ecotoxicol. Environ. Saf.