
Fig. 2
- ID
- ZDB-IMAGE-210325-21
- Genes
- Antibodies
- Publication
- Tschaikner et al., 2021 - Feedback Control of the Gpr161-Gαs-PKA axis contributes to basal Hedgehog repression in zebrafish
- All Figures
- Figures for Tschaikner et al., 2021
|
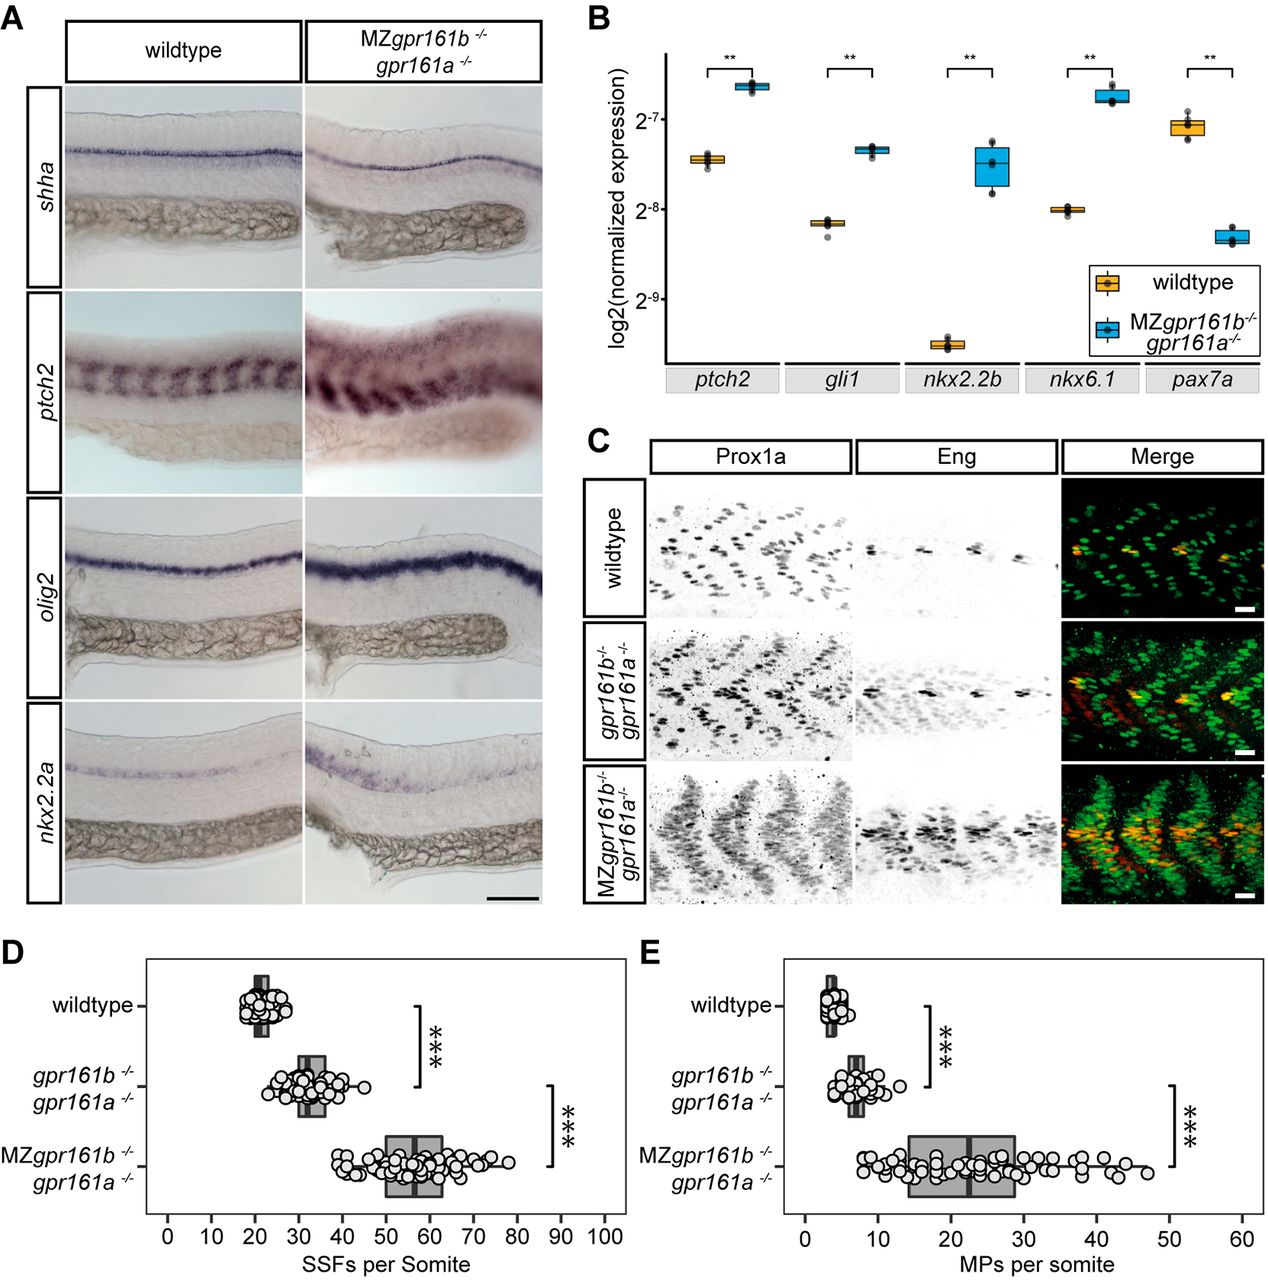
Fig. 2 Hh signalling activity is increased in gpr161 mutants. (A) RNA in situ hybridisation of shha, ptch2, olig2 and nkx2.2a transcripts in wild-type and MZgpr161b−/−; gpr161a−/− embryos fixed at 24 hpf (lateral view). Scale bar: 100 µm. (B) Transcript levels of ptch2, gli1, nkx2.2b, nkx6.1 and pax7a in wild-type and MZgpr161b−/−; gpr161a−/− embryos at 24 hpf determined by RT-qPCR (n=3; **P<0.01, Kruskal–Wallis rank sum test, Dunn's post-hoc test for multiple comparisons). (C) Immunostaining of Prox1 and Eng proteins in 24 hpf zebrafish embryos reveals the number of MPs (Prox1a/Eng double positive) as well as SFFs (Prox1 positive) in wild-type, gpr161b−/−; gpr161a−/− and MZgpr161b−/−; gpr161−/− embryos fixed at 24 hpf. Scale bars: 20 µm. (D,E) Number of (D) SSFs and (E) MPs per somite in wild-type (n=93 somites in 22 embryos), gpr161b−/−; gpr161a−/− (n=60 somites in 20 embryos) and MZgpr161b−/−; gpr161a−/− (n=66 somites in 22 embryos) embryos fixed at 24 hpf. ***P<0.001 (one-way ANOVA, Tukey's post-hoc test for pairwise comparisons). Box plots show median values (centre lines) and the interquartile ranges (boxes); whiskers extend to the highest and lowest values within 1.5×IQR (inter-quartile range).