
Figure 5
- ID
- ZDB-IMAGE-191230-326
- Genes
- Publication
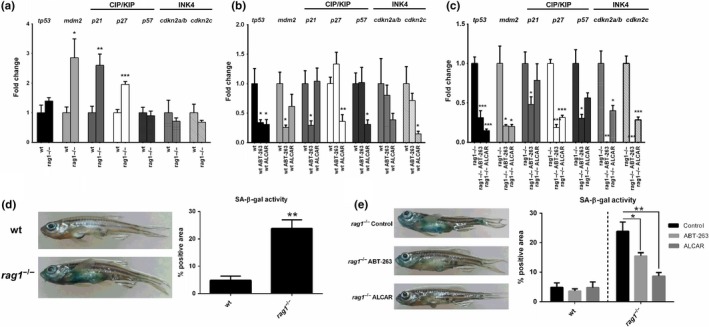
- Novoa et al., 2019 - Rag1 immunodeficiency-induced early aging and senescence in zebrafish are dependent on chronic inflammation and oxidative stress
- All Figures
- Figures for Novoa et al., 2019
|
Figure 5
Senescence detection in