
Fig. 4
- ID
- ZDB-IMAGE-100319-23
- Genes
- Publication
- Feng et al., 2010 - Pivotal role of hmx2 and hmx3 in zebrafish inner ear and lateral line development
- All Figures
- Figures for Feng et al., 2010
|
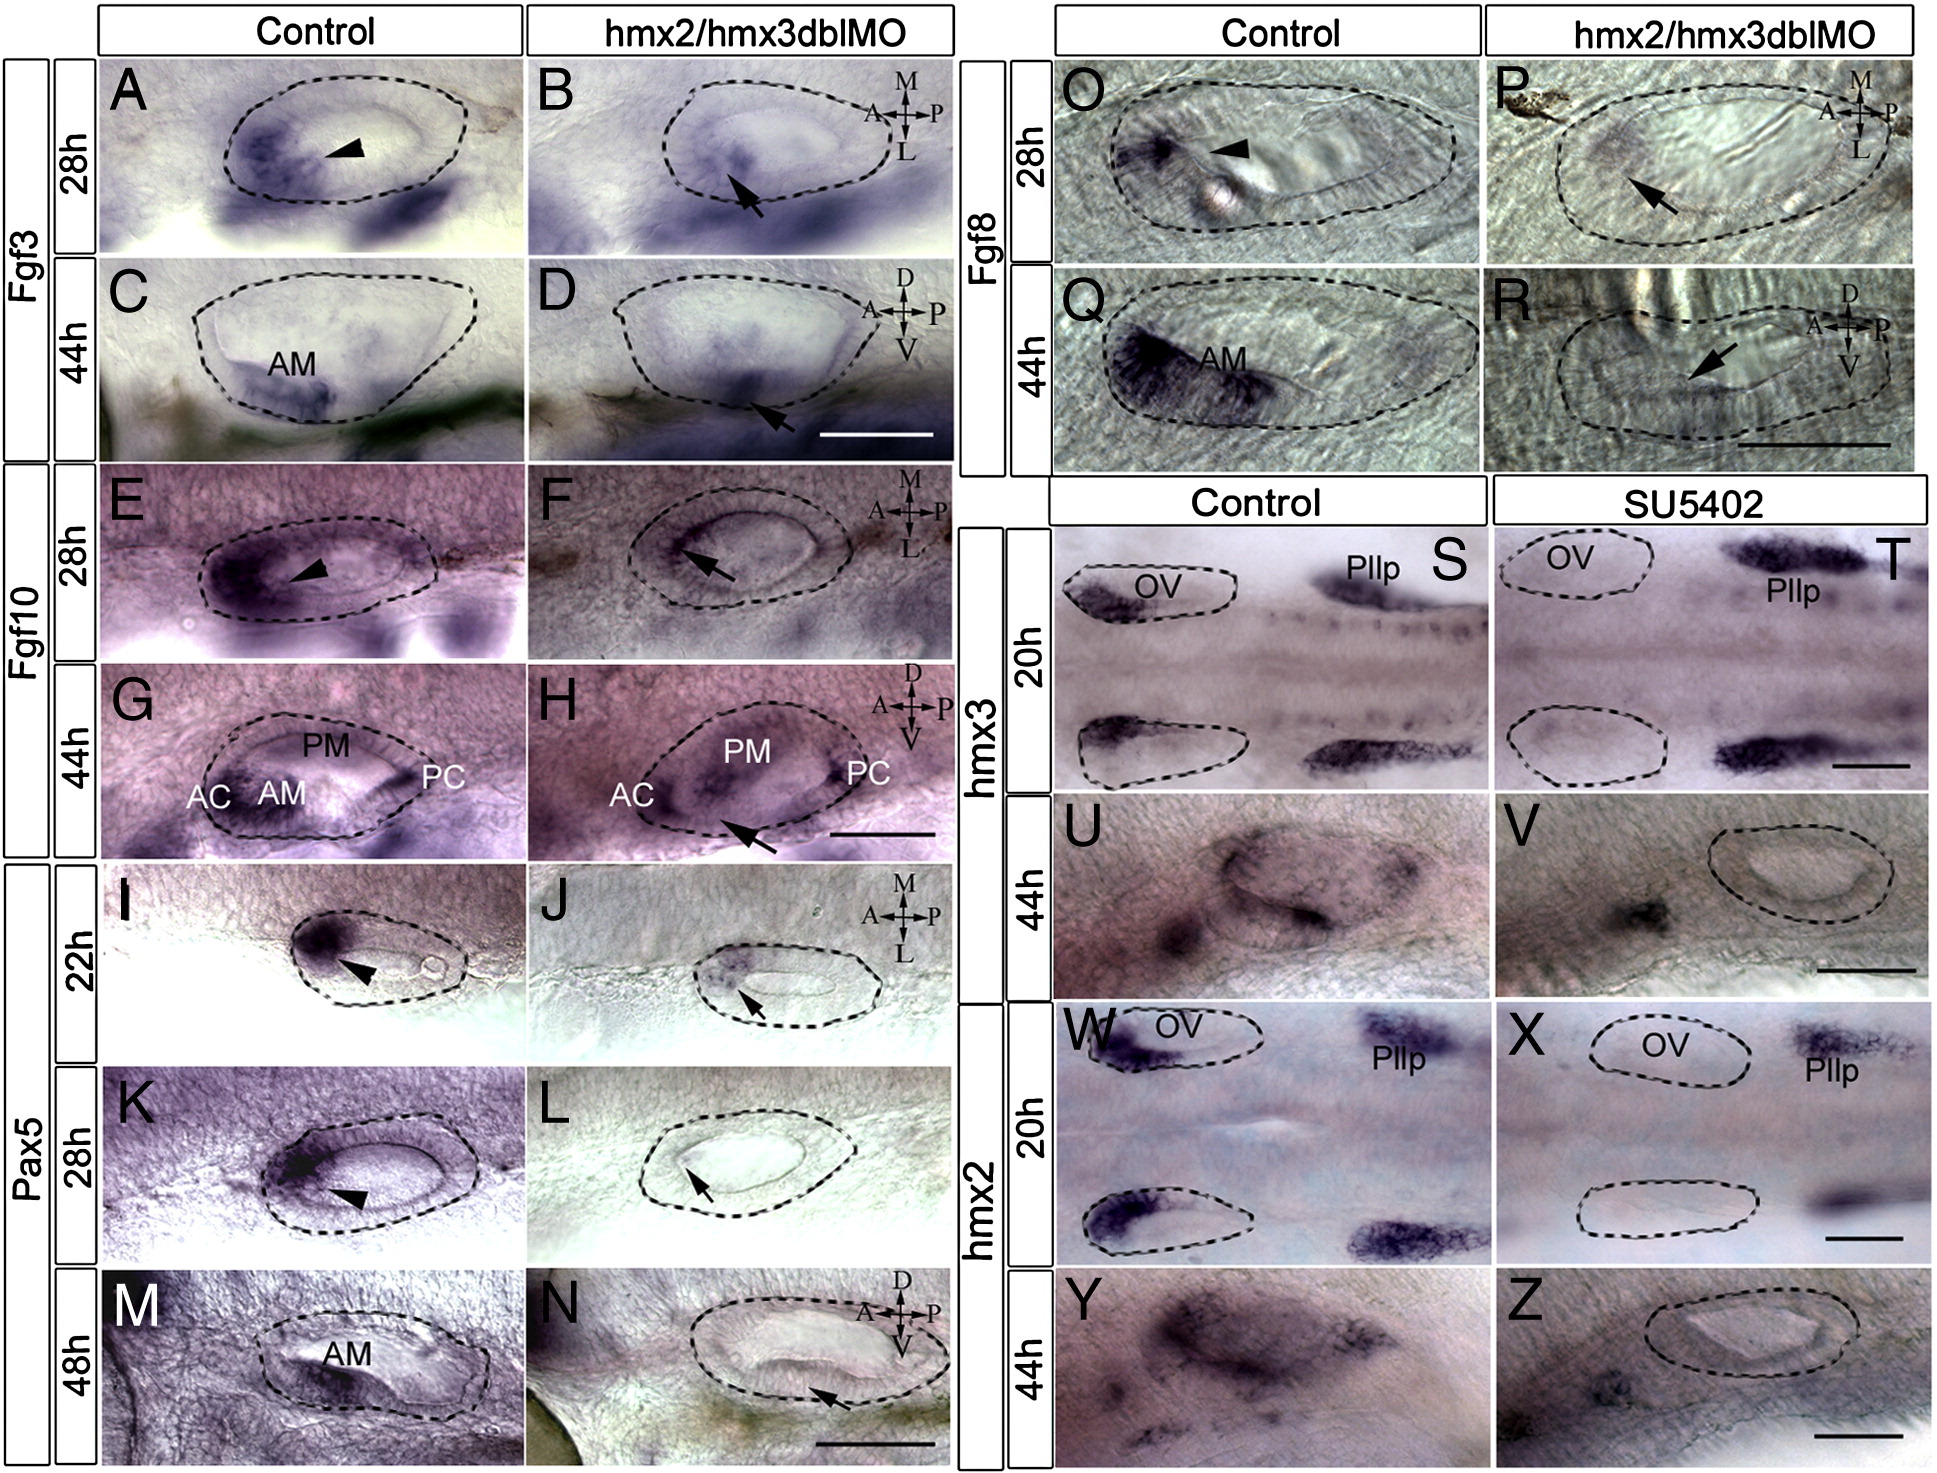
Fig. 4 Expression of fgf3, fgf8, fgf10, and pax5 in hmx2/hmx3 morphants and of hmx2 and hmx3 in SU5402-treated embryos. All images are anterior to the left, and orientations are indicated. Dorsal view at 28 hpf and lateral view at 44 hpf. Otic vesicle is highlighted with a dotted line. fgf3 ( A, C) control, (B, D) morphant; fgf10 (E, G) control, (F, H) morphants; fgf8 ( O, Q) control, ( P, R) morphants; pax5 (I, K, M) control, (J, L, N) morphants. Dorsal view in panels S–Z. Embryos treated in 5% DMSO with or without SU5402 from 14 to 21 hpf (S, T, W, X) or 24 s to 44 hpf (U, V, Y, Z). hmx3 (S–V); hmx2 (W–Z). Arrowhead indicates the normal expression, and arrow indicates reduced signals. Scale bar: 50 μm. Abbreviations: OV, otic vesicle; Pllp, posterior lateral line primordium; AM, anterior maculae; PM, posterior maculae; AC, anterior cristae; PC, posterior cristae.
Reprinted from Developmental Biology, 339(2), Feng, Y., and Xu, Q., Pivotal role of hmx2 and hmx3 in zebrafish inner ear and lateral line development, 507-518, Copyright (2010) with permission from Elsevier. Full text @ Dev. Biol.