
Fig. 1
|
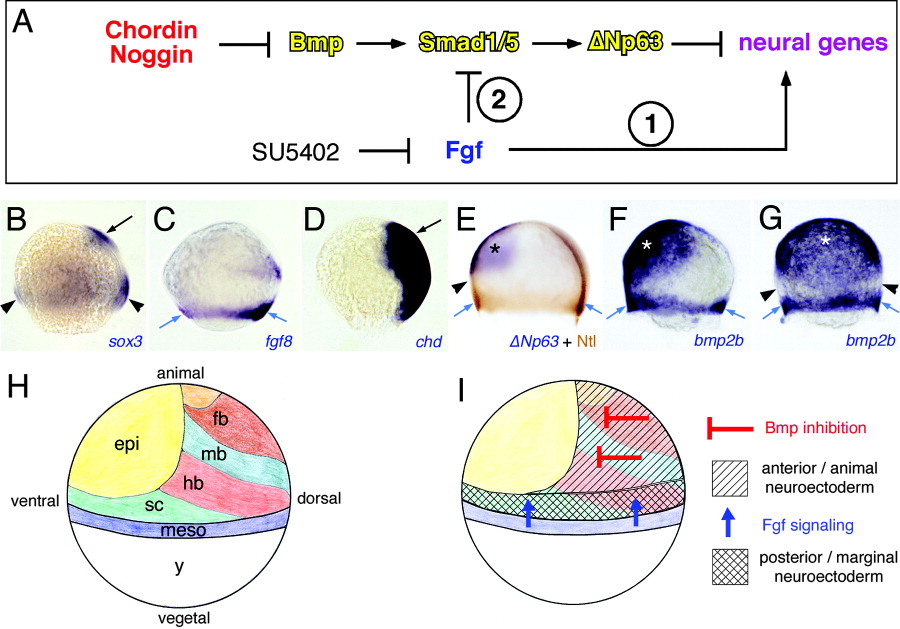
Fig. 1 Diagram illustrating the epistatic relationships between Chordin and Noggin, bone morphogenetic proteins (Bmps), Smad transcription factors, and ΔNp63 during neural induction. In addition, two alternative routes of fibroblast growth factor (Fgf) function are indicated, acting either by means of an inhibition of Smad proteins (2) or independently of Bmp signaling (1). B-G: Expression pattern of genes indicated in the lower right corner at midgastrula stages (80%-90% epiboly). B-F show the lateral view, dorsal to the right, anterior/animal pole up; and G shows the ventral view. Blue arrows indicate mesoderm of germ ring, black arrows anterior/animal neuroectoderm, arrowheads posterior/marginal neuroectoderm, and stars non-neural ectoderm. H: Distribution of ectodermal and mesodermal cells in midgastrula embryo, modified from Woo and Fraser (1995) and Thisse et al. (2000). I: Diagram illustrating differential induction of anterior neuroectoderm by Bmp inhibitors from the dorsal axis and of posterior neuroectoderm by Fgf signaling from the germ ring mesoderm. chd, chordin; Ntl, No tail (Brachyury/T); fb, forebrain; mb, midbrain; hb, hindbrain; sc, spinal cord; meso, mesoderm; y, yolk.