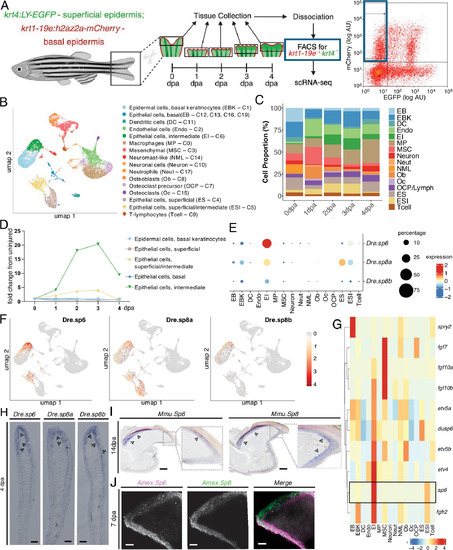
Epidermal SP transcription factor expression is a conserved program of appendage regeneration. (A) Schematic of sample collection and enzymatic dissociation for RNA-seq profiling of mCherry/EGFP zebrafish fins at 0, 1, 2, 3, and 4 d postamputation (dpa). For 0 dpa, 1.5 mm fin tissue segments were collected from the central region of intact fins. Regenerating samples were collected at 1 to 4 dpa from newly regenerating fin tissue. At each time point, dissociated cells were enriched for basal epidermal cells by FACS using endogenous reporter fluorescence, followed by single-cell RNA sequencing of the krt1-19e:h2az2a-mCherry+, krt4:LY-EGFP− population. (B) UMAP visualization of integrated scRNA-seq datasets showing cell clusters (C) with annotated identities. Assigned cell types include: epidermal cells, basal keratinocytes (EBK, C1), epithelial cells, basal (EB, C12, C13, C16, C19), dendritic cells (DC, C11), endothelial cells (Endo, C2), epithelial cells, intermediate (EI, C6), macrophages (MP, C0), mesenchymal cells (MSC, C3), neuromast-like cells (NML, C14), neurons (C10), neutrophils (Neut, C17), osteoblasts (Ob, C8), osteoclast precursors (OCP, C7), osteoclasts (Oc, C15), epithelial cells, superficial (SE, C4), epithelial cells, superficial/intermediate (ESI, C5), and T cells (C9). (C) Bar plot showing the percentage distribution of the cell types identified in (B), grouped by collection stage, illustrating changes in cellular composition across regeneration. (D) Dynamics of epithelial clusters over time (1 to 4 dpa), shown as fold change relative to uninjured tissue, highlighting temporal shifts in epithelial subpopulations during fin regeneration. (E) Dot plot showing differential expression of Dre.sp6, Dre.sp8a, and Dre.sp8b across the cell type clusters, illustrating their enrichment patterns. Color intensity indicates expression level (dark blue = low, red = high), while circle size represents the percentage of cells expressing each gene (small = low, large = high). (F) UMAP feature plots showing the distribution of Dre.sp6, Dre.sp8a, and Dre.sp8b expression across cell clusters. Expression levels are indicated by color intensity, with gray representing low and red representing high expression. (G) Heatmap showing expression of Dre.sp6 and Fgf signaling pathway genes across cell types. Coexpression patterns are evident, with many Fgf pathway genes enriched in intermediate epithelial (EI) cells alongside Dre.sp6. (H) In situ hybridization (ISH) detecting Dre.sp6, Dre.sp8a, and Dre.sp8b expression in regenerating fins at 4 dpa. Arrows indicate sites of transcript enrichment within the regenerating epidermis. (Scale bars, 50 μm.) (I) ISH for Mmu.Sp6 and Mmu.Sp8 on sagittal sections of regenerating mouse digit tips (P3) at 14 dpa. Black arrowheads indicate domains of transcript enrichment within the regenerating nail matrix and RE. (Scale bars, 100 μm.) (J) Hybridization chain reaction whole-mount fluorescent ISH (HCR WMFISH) of Amex.Sp6 and Amex.Sp8 in lower limb (mid radius/ulna) at 7 dpa with DAPI merge (Right panel). Images represent maximum intensity projection of 25 µm z-depth. (Scale bars, 100 μm.)
|
