
Fig. 4.
- ID
- ZDB-FIG-260518-26
- Publication
- Brown et al., 2026 - Enhancer-directed gene delivery for digit regeneration based on conserved epidermal factors
- Other Figures
- All Figure Page
- Back to All Figure Page
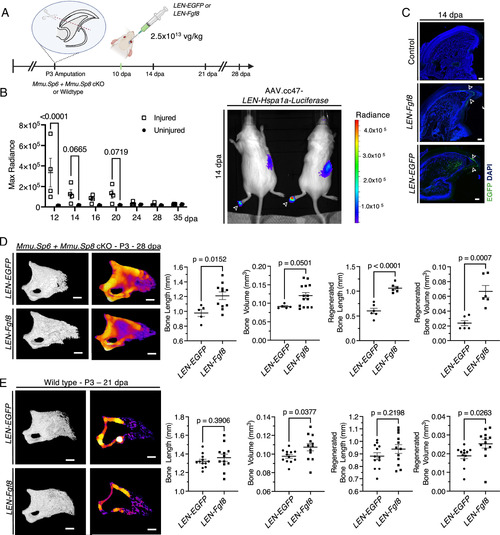
Targeted Fgf8 gene transfer to regenerating digit tips enhances bone regrowth. (A) AAV was systemically administered to 2- to 6-mo-old mice via retro-orbital injection at a dose of 2.5 × 10¹³ viral genomes per kilogram of body weight. The injection was performed 10 d after P3 amputation (10 dpa), and tissues were collected at 14, 21, and 28 dpa. (B) Bioluminescence imaging of regenerating digits (P3) following AAV.cc47-LEN-Hspa1a-Luciferase delivery. Representative images at 14 dpa (Top) show luciferase activity localized to the injured digits (arrow). Quantification of radiance (Bottom) is shown at 12, 14, 16, 20, 24, 28, and 35 dpa in injured vs. uninjured digits. Data are presented as mean ± SEM (n = 4); P-values are indicated. P-values were calculated from two-way ANOVA. (C) EGFP expression in regenerating P3 digits at 14 dpa following injection of AAV.cc47-LEN-Hspa1a-EGFP (LEN-EGFP) or AAV.cc47-LEN-Hspa1a-FGF8-P2A-EGFP (LEN-Fgf8), compared with control. EGFP (green) marks transgene expression, and nuclei are counterstained with DAPI (blue). Arrows indicate EGFP expression in the distal epidermis. (Scale bars, 100 μm.) (D) Micro-CT reconstructions and quantitative analysis of digit regeneration in Sp6+Sp8 cKO mice at 28 dpa following injection of LEN-EGFP or LEN-FGF8. Representative 3D reconstructions (Left) and heat maps of mineralized tissue (Middle) show bone morphology and density. Quantification (Right) includes total bone length, bone volume, regenerated bone length, and regenerated bone volume. Data are presented as mean ± SEM (n = 6 per group); P-values are indicated. (Scale bars, 200 μm.) P-values were calculated from one-way ANOVA. (E) Micro-CT reconstructions and quantitative analysis of digit regeneration in wild-type mice (P3) at 21 dpa following injection of LEN-EGFP or LEN-Fgf8 vectors. Representative 3D reconstructions (Left) and heat maps of mineralized tissue (Middle) show bone morphology and density. Quantification (Right) includes total bone length, bone volume, regenerated bone length, and regenerated bone volume. Data are presented as mean ± SEM (n = 12 per group); P-values are indicated. (Scale bars, 200 μm.) P-values were calculated from one-way ANOVA. |