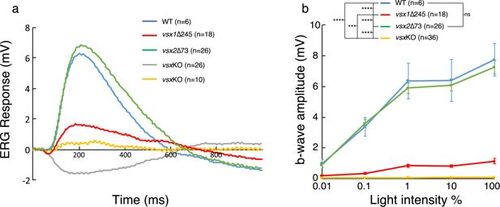
ERG response is reduced in vsxKO larvae. (a) Representative ERG tracks at maximum light intensity from WT (blue), vsx1∆245 (red), vsx2∆73 (green) and vsxKO double mutants (grey and yellow) at 5dpf. For vsxKO larvae, two typical recordings are shown (grey and yellow tracks). (b). Averaged ERG b-wave amplitudes from WT (blue), vsx1∆245 (red), vsx2∆73 (green) and vsxKO (yellow) larvae. No significant differences were observed between WT and vsx2∆73 samples. vsx1∆245 and vsxKO mutants produce a significant reduction of the ERG b-wave amplitude compared with both WT and vsx2∆73 larvae throughout all light intensities tested (***p<0.0001, ****p<0.00001). Data are shown as mean ± SEM. In (a) and (b), vsx1∆245 (red tracks) represents both vsx1∆245-/- and vsx1∆245-/-; vsx2∆73+/-genotypes, while vsx2∆73 (green tracks) represents both vsx2∆73-/- and vsx1∆245+/-; vsx2∆73-/- genotypes. Data were collected from five independent experiments. For statistical comparison, one way ANOVA test was used. ms: milliseconds, mV: millivolts.
|
