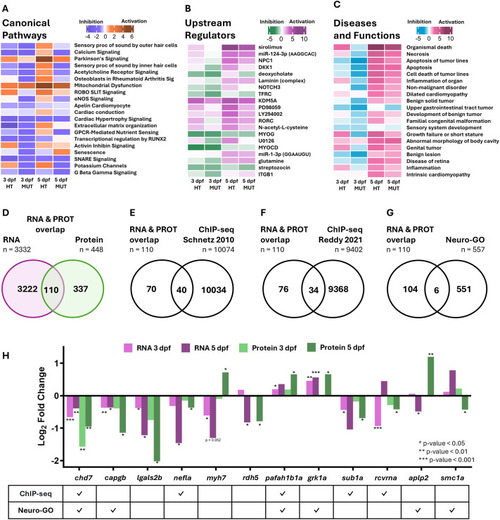
Transcript and protein expression patterns inform downstream pathway, regulator and functional analysis. (A) IPA canonical pathway enrichment by patterns of DEGs with P<0.05 (Wald test) from 3 dpf and 5 dpf HT and MUT versus WT comparisons. (B) IPA upstream regulator enrichment by patterns of DEGs with P<0.05 from 3 dpf and 5 dpf HT and MUT versus WT comparisons. (C) IPA disease and function enrichment by patterns of DEGs with P<0.05 (Wald test) from 3 dpf and 5 dpf HT and MUT versus WT comparisons (IPA canonical pathway, upstream regulator, and disease and function enrichment by patterns of DEPs are shown in Fig. S18). (D) Overlap of DEGs with P<0.05 (Wald test) from 3 dpf and 5 dpf HT and MUT versus WT comparisons and DEPs with P<0.05 (one-way ANOVA) from HT and MUT versus WT comparisons. (E) Overlap of DEGs and DEPs from D with chromatin immunoprecipitation sequencing (ChIP-seq) data from Schnetz et al. (2010). (F) Overlap of DEGs and DEPs from D with ChIP-seq data from Reddy et al. (2021). (G) Overlap of DEGs and DEPs from D with Neuro-GO list. (H) Log2 FC of selected candidate DEGs and DEPs from MUT versus WT comparison plotted at 3 dpf and 5 dpf, and table below noting presence in ChIP-seq or Neuro-GO list. *P<0.05, **P<0.01, ***P<0.001.
|
