|
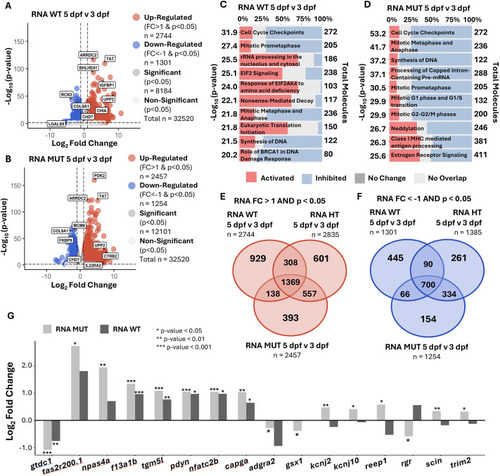
Neural-related transcripts with protein counterparts change developmentally from 3 dpf to 5 dpf due to loss of chd7. (A,B) Volcano plots of DEGs: 5 dpf WT compared to 3 dpf WT samples (A), and 5 dpf MUT compared to 3 dpf MUT samples (B). (C,D) Ingenuity Pathway Analysis (IPA) pathway enrichment by patterns of DEGs from 5 dpf WT compared to 3 dpf WT samples (C), and 5 dpf MUT compared to 3 dpf MUT samples (D). (E,F) Overlap of DEGs in 5 dpf WT versus 3 dpf WT, 5 dpf HT versus 3 dpf HT, and 5 dpf MUT versus 3 dpf MUT. (E) DEGs upregulated with FC>1 and P<0.05 (Wald test). (F) DEGs downregulated with FC<−1 and P<0.05 (Wald test). (G) Log2 FC for DEGs selected for most differing FC from Fig. S6, and all DEGs overlapping with the Neuro-GO list in Fig. S7 (underlined in red) and Fig. S8 (underlined in blue). *P<0.05, **P<0.01, ***P<0.001.
|