|
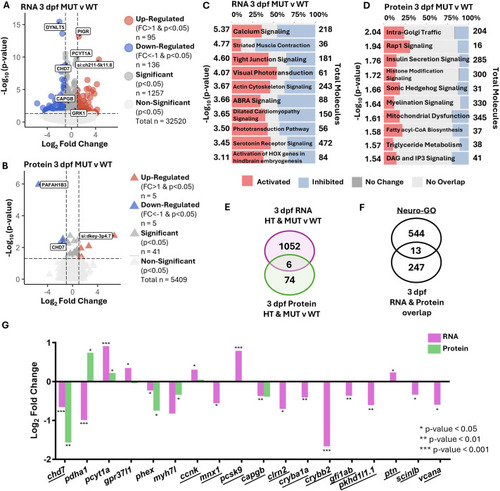
Early neurodevelopmental transcripts with protein counterparts and neural signaling pathways emerge due to loss of chd7 at 3 dpf. (A) Volcano plot of DEGs comparing 3 dpf HT to 3 dpf WT samples. (B) Volcano plot of differentially expressed proteins (DEPs) comparing 3 dpf MUT to 3 dpf WT samples. (C,D) IPA pathway enrichment by patterns of DEGs from 3 dpf MUT compared to WT samples (C), and patterns of DEPs from 3 dpf MUT compared to WT samples (D). (E) Overlap of DEGs with P<0.05 (Wald test) from 3 dpf HT and MUT versus WT samples (purple) and DEPs with P<0.05 (one-way ANOVA) from 3 dpf HT and MUT versus WT samples (green). (F) Overlap of 3 dpf DEGs and DEPs from Fig. S11 and Neuro-GO list. (G) Log2 FC for all DEGs and DEPs from MUT versus WT comparison from overlap in E and from overlap in F (underlined). *P<0.05, **P<0.01, ***P<0.001.
|