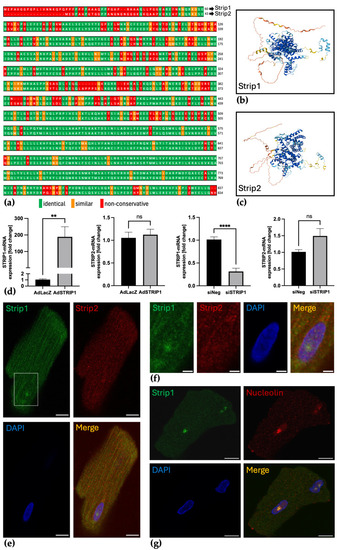
Structural similarity and distinct expression patterns of Strip1 and Strip2 in cardiomyocytes. (a) Alignment of Strip1 and Strip2 amino acid sequences using EMBOSS Matcher highlights conserved regions [28]; (b) Predicted structures of Strip1 and (c) Strip2 generated using AlphaFold [29,30] reveal similar domain organization. Color indicates per-residue model confidence (pLDDT): very high (pLDDT > 90, dark blue), high (70–90, light blue), low (50–70, yellow), and very low (<50, orange) [29,30]; (d) qPCR analysis of STRIP1 and STRIP2 mRNA following adenoviral-mediated overexpression of STRIP1 (AdSTRIP1, 50 ifu, 72 h—control: AdLacZ) or siRNA-mediated knockdown (siSTRIP1, 128 pmol, 96 h; control: siControl) in NRVCMs. While STRIP1 levels are significantly increased after AdSTRIP1 and decreased after siSTRIP1 compared to control, STRIP2 expression remains unchanged (n = 3); (e) Immunofluorescence staining of ARVCMs for Strip1 (green) and Strip2 (red) shows cytosolic and perinuclear colocalization; Strip1 additionally accumulates in an intranuclear round focus; (f) Enlarged view of boxed region from (e); (g) Immunofluorescence staining of ARVCMs for Strip1 and nucleolar marker Nucleolin demonstrates nucleolar colocalization; nuclei are counterstained with DAPI (blue); Scale bars: (e,g) 10 µm; (f) 3 µm; Student’s t-test; ns = not significant; ** p < 0.01; **** p < 0.0001; Data are shown as mean ± SEM.
|
