IMAGE

Figure 2

ID
ZDB-IMAGE-260330-142
Publication
Heilein et al., 2026 - Strip1 Is a Novel Negative Regulator of Cardiomyocyte Hypertrophy
All Figures
Figures for Heilein et al., 2026
Image
Figure Caption

Figure 2

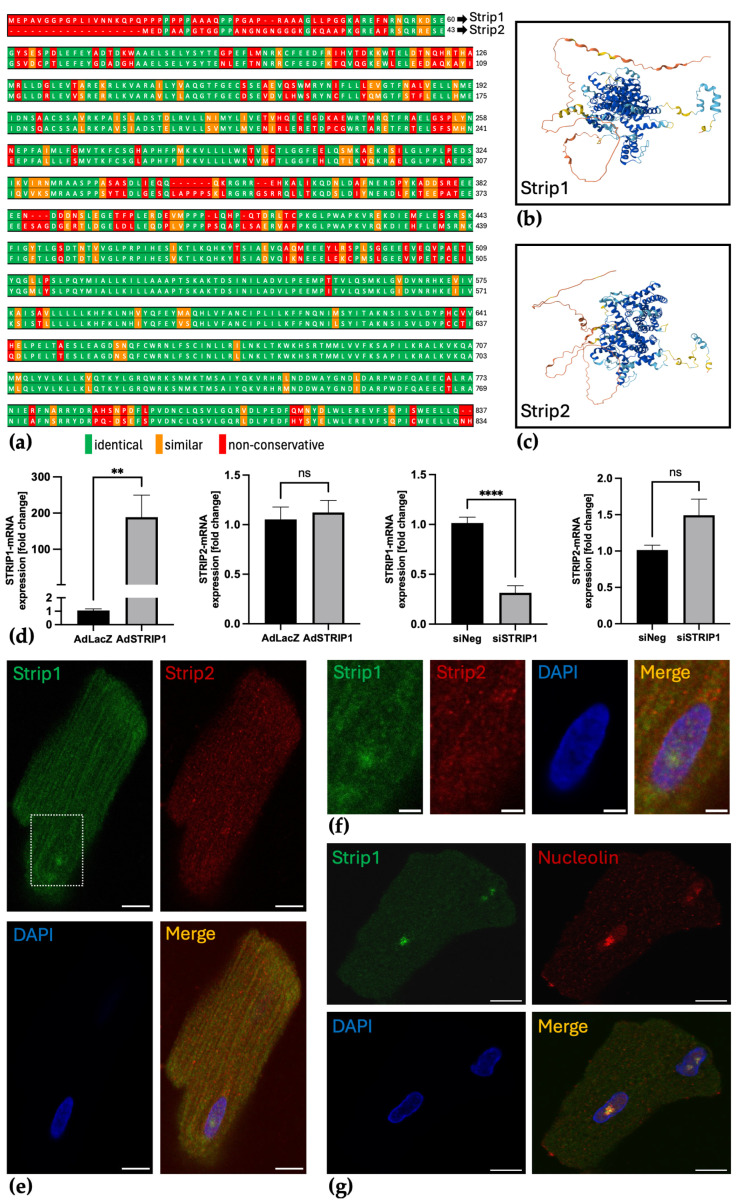
Structural similarity and distinct expression patterns of Strip1 and Strip2 in cardiomyocytes. (a) Alignment of Strip1 and Strip2 amino acid sequences using EMBOSS Matcher highlights conserved regions [28]; (b) Predicted structures of Strip1 and (c) Strip2 generated using AlphaFold [29,30] reveal similar domain organization. Color indicates per-residue model confidence (pLDDT): very high (pLDDT > 90, dark blue), high (70–90, light blue), low (50–70, yellow), and very low (<50, orange) [29,30]; (d) qPCR analysis of STRIP1 and STRIP2 mRNA following adenoviral-mediated overexpression of STRIP1 (AdSTRIP1, 50 ifu, 72 h—control: AdLacZ) or siRNA-mediated knockdown (siSTRIP1, 128 pmol, 96 h; control: siControl) in NRVCMs. While STRIP1 levels are significantly increased after AdSTRIP1 and decreased after siSTRIP1 compared to control, STRIP2 expression remains unchanged (n = 3); (e) Immunofluorescence staining of ARVCMs for Strip1 (green) and Strip2 (red) shows cytosolic and perinuclear colocalization; Strip1 additionally accumulates in an intranuclear round focus; (f) Enlarged view of boxed region from (e); (g) Immunofluorescence staining of ARVCMs for Strip1 and nucleolar marker Nucleolin demonstrates nucleolar colocalization; nuclei are counterstained with DAPI (blue); Scale bars: (e,g) 10 µm; (f) 3 µm; Student’s t-test; ns = not significant; ** p < 0.01; **** p < 0.0001; Data are shown as mean ± SEM.

Acknowledgments
This image is the copyrighted work of the attributed author or publisher, and ZFIN has permission only to display this image to its users. Additional permissions should be obtained from the applicable author or publisher of the image. Full text @ Cells