FIGURE

Figure 4

ID
ZDB-FIG-260330-139
Publication
Heilein et al., 2026 - Strip1 Is a Novel Negative Regulator of Cardiomyocyte Hypertrophy
Other Figures
All Figure Page
Back to All Figure Page
Figure 4

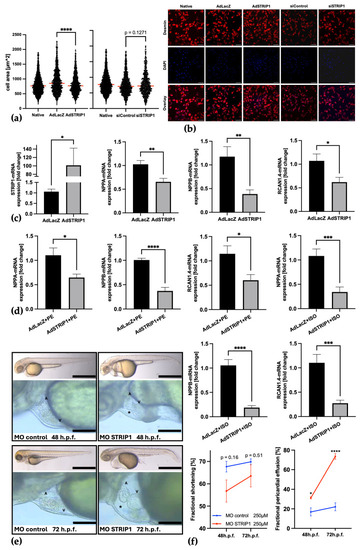
Strip1 modulates cardiomyocyte hypertrophy in vitro and in vivo. (a) Quantification of NRVCM area (µm2) under conditions: Native, siControl, siSTRIP1, AdLacZ and AdSTRIP1. Cell area in AdSTRIP1 is significantly reduced compared to AdLacZ, while NRVCMs after siSTRIP1 show no significant difference from siControl. Apart from changes in cell size, no obvious morphological alterations were observed. For visualization, the scatter plot displays individual cell measurements. Statistical analyses were performed using the mean cell area of each biological replicate as the statistical unit (n = 3 biological replicates); (b) Representative immunofluorescence images for each condition, showing Desmin (cell bodies), DAPI (nuclei), and merged overlays; High-resolution images of Figure 4b are shown in Supplementary Figure S4; (c) qPCR analysis shows that NPPA, NPPB, and RCAN1.4 mRNA expression is significantly reduced 72 h after AdSTRIP1 infection (50 ifu) compared to AdLacZ control in NRVCMs (n = 3); (d) with additional stimulation during the final 24 h with phenylephrine (PE, 100 µM or isoproterenol (ISO, 10 µM), this significant reduction in NPPA, NPPB and RCAN1.4 becomes more pronounced; (e,f) Zebrafish embryos with morpholino-induced STRIP1 knockdown (MO STRIP1; n = 5) at 48 hpf and 72 hpf (hours post fertilization) show reduced but non-significant fractional shortening compared to control morpholino-treated embryos (MO control; n = 4). In contrast, MO STRIP1 embryos exhibited significant pericardial effusion (=*), pronounced at 72 hpf (A = atrium, V = ventricle); Scale bars: (b) 100 µm; (e,f) 60 µm in whole-embryo image & 20 µm in cardiac close-up; Student’s t-test; ns = not significant; * p < 0.05; ** p < 0.01; *** p < 0.001; **** p < 0.0001; Data are shown as mean ± SEM.

Expression Data

Expression Detail
Antibody Labeling
Phenotype Data
Fish:
Knockdown Reagent:
Observed In:
Stage Range: Long-pec to Protruding-mouth

Phenotype Detail
Acknowledgments
This image is the copyrighted work of the attributed author or publisher, and ZFIN has permission only to display this image to its users. Additional permissions should be obtained from the applicable author or publisher of the image. Full text @ Cells