FIGURE

Figure 1

ID
ZDB-FIG-260330-136
Publication
Heilein et al., 2026 - Strip1 Is a Novel Negative Regulator of Cardiomyocyte Hypertrophy
Other Figures
All Figure Page
Back to All Figure Page
Figure 1

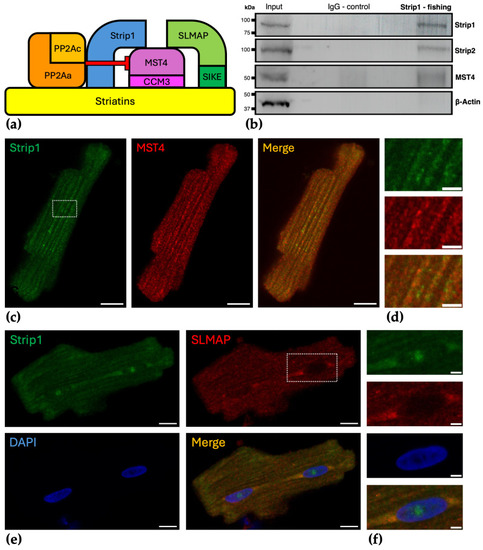
Strip1’s association with key cardiomyocyte STRIPAK components and its subcellular localization. (a) Proposed STRIPAK complex schematic in cardiomyocytes, based on diverse models from various contexts and cell types by Jeong et al. [17], Tang et al. 2019 [18] and Shi et al. 2016 [5], illustrating Strip1 centrally positioned with interactions to PP2A, striatins, and GCKII/GCKIII kinases, here represented by MST4 as a GCKIII kinase. Red T-shaped bar indicates inhibition of GCKII/GCKIII by PP2A [5,17,18]; (b) Co-IP from NRVCM lysates using Strip1 antibody for pulldown. Immunoblotting for Strip2 and MST4 detects bands in Strip1 pulldown samples, while β-actin serves as a negative control. Uncropped full-length blots are shown in Supplementary Figure S1; (c) Immunofluorescence staining of ARVCMs for Strip1 (green) and MST4 (red) demonstrates cytosolic colocalization in merged image; boxed area is enlarged in (d); (e) Immunofluorescence staining of ARVCMs for Strip1 (green) and SLMAP (red) with DAPI nuclear counterstain shows colocalization in the cytosol and perinuclear region; additional nuclear localization of Strip1 is observed; (f) boxed region from (e) enlarged; Scale bars: (c,e) 10 µm; (d,f) 3 µm;.

Expression Data

Expression Detail
Antibody Labeling
Phenotype Data

Phenotype Detail
Acknowledgments
This image is the copyrighted work of the attributed author or publisher, and ZFIN has permission only to display this image to its users. Additional permissions should be obtained from the applicable author or publisher of the image. Full text @ Cells