|
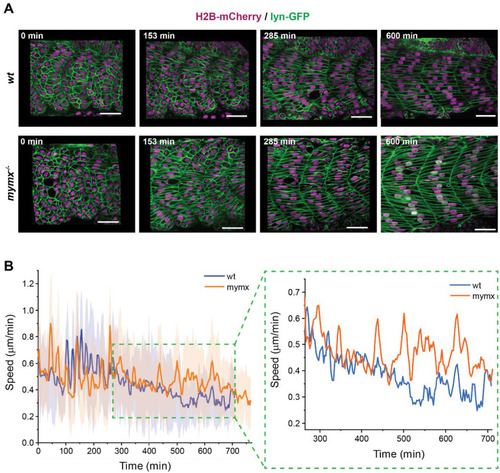
Dynamics of muscle precursor cell rearrangements during early myogenesis. (A) Timelapse imaging of myotome development in a wild-type (top) and a mymx−/− (bottom) embryo injected with H2B-mCherry and lyn-GFP mRNAs to visualise nuclei (magenta) and cell membranes (green), respectively (scale bars: 30 µm). (B) Average cell speed from wild-type and mutant embryos, starting out in similar positions in the myotome (n=40 cells from four myotomes). The solid line represents the mean and shaded areas represent the standard deviation. Right panel shows an inset of the window within the green box, marking the period during which most of the initial fusion events occurred in wild-type embryos. Error bars omitted for clarity (shown on left). The speed difference is significant (P<0.01) between 500-700 min (two-sided t-test, grouping the data into 100 min bins, with four independent samples).
|