FIGURE

Fig. 3.

ID
ZDB-FIG-260101-59
Publication
Dhar et al., 2025 - Dynamic expression and differential requirement of the myocyte fusogen Myomixer during distinct myogenic episodes in the zebrafish
Other Figures
All Figure Page
Back to All Figure Page
Fig. 3.

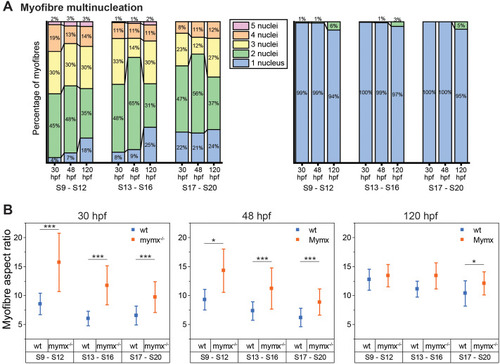
Quantification of phenotypic effects on cell structure in mymx−/− embryos. (A) Percentage of myofibres with the respective number of nuclei in wild-type (left) and mymx−/− (right) embryos at 30, 48 and 120 hpf. (B) Aspect ratio (long axis to short axis) of myofibres at different developmental stages in wild-type (blue) and mymx−/− (orange) embryos. Myotomes grouped by somite numbers (S9 to S12, S13 to S16, and S17 to S20). Error bars represent the standard deviation (n=12 myotomes from three embryos). Difference between groups were calculated by two-sided permutation t-test and represented as: *P<0.05, **P<0.01, ***P<0.001.

Expression Data

Expression Detail
Antibody Labeling
Phenotype Data
Fish:
Observed In:
Stage Range: Prim-15 to Day 5

Phenotype Detail
Acknowledgments
This image is the copyrighted work of the attributed author or publisher, and ZFIN has permission only to display this image to its users. Additional permissions should be obtained from the applicable author or publisher of the image. Full text @ Biol. Open