
Fig. 5.
- ID
- ZDB-IMAGE-260101-59
- Publication
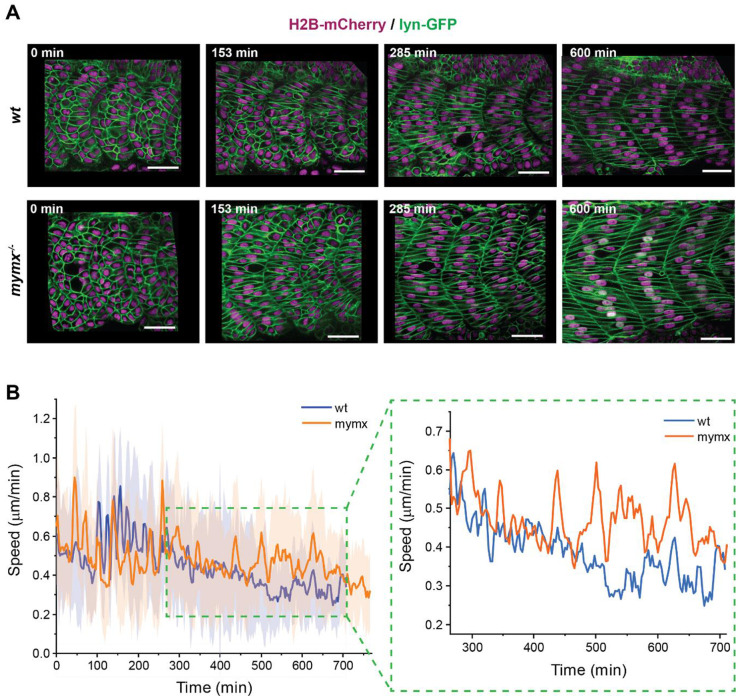
- Dhar et al., 2025 - Dynamic expression and differential requirement of the myocyte fusogen Myomixer during distinct myogenic episodes in the zebrafish
- All Figures
- Figures for Dhar et al., 2025
|
Fig. 5.