
FIGURE
Fig. 6 - Supplemental 2
- ID
- ZDB-FIG-251202-48
- Publication
- Lopez-Blanch et al., 2025 - Phenotypic impact of individual conserved neuronal microexons and their master regulators in zebrafish
- Other Figures
-
- Fig. 1
- Fig. 1 - Supplemental 1
- Fig. 2
- Fig. 2 - Supplemental 1
- Fig. 3
- Fig. 3 - Supplemental 1
- Fig. 3 - Supplemental 2
- Fig. 4
- Fig. 4 - Supplemental 1
- Fig. 4 - Supplemental 2
- Fig. 4 - Supplemental 3
- Fig. 4 - Supplemental 4
- Fig. 4 - Supplemental 5
- Fig. 4 - Supplemental 6
- Fig. 4 - Supplemental 7
- Fig. 4 - Supplemental 8
- Fig. 4 - Supplemental 9
- Fig. 4 - Supplemental 10
- Fig. 4 - Supplemental 11
- Fig. 4 - Supplemental 12
- Fig. 4 - Supplemental 13
- Fig. 5
- Fig. 5 - Supplemental 1
- Fig. 5 - Supplemental 2
- Fig. 5 - Supplemental 3
- Fig. 5 - Supplemental 4
- Fig. 5 - Supplemental 5
- Fig. 5 - Supplemental 6
- Fig. 5 - Supplemental 7
- Fig. 5 - Supplemental 8
- Fig. 5 - Supplemental 9
- Fig. 5 - Supplemental 10
- Fig. 6
- Fig. 6 - Supplemental 1
- Fig. 6 - Supplemental 2
- All Figure Page
- Back to All Figure Page
Fig. 6 - Supplemental 2
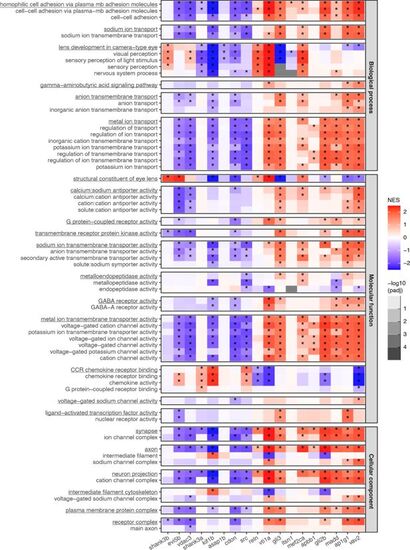
Enriched GO categories. Enrichment of individual GO categories from category groups highlighted in Figure 6C for each microexon deletion. Each block is a group of related GO categories, and the block is named after the underlined category. Values obtained from Gene Set Enrichment Analyses (GSEA). |
Expression Data
Expression Detail
Antibody Labeling
Phenotype Data
Phenotype Detail
Acknowledgments
This image is the copyrighted work of the attributed author or publisher, and
ZFIN has permission only to display this image to its users.
Additional permissions should be obtained from the applicable author or publisher of the image.
Full text @ Elife