
FIGURE
Fig. 4 - Supplemental 1
- ID
- ZDB-FIG-251202-22
- Publication
- Lopez-Blanch et al., 2025 - Phenotypic impact of individual conserved neuronal microexons and their master regulators in zebrafish
- Other Figures
-
- Fig. 1
- Fig. 1 - Supplemental 1
- Fig. 2
- Fig. 2 - Supplemental 1
- Fig. 3
- Fig. 3 - Supplemental 1
- Fig. 3 - Supplemental 2
- Fig. 4
- Fig. 4 - Supplemental 1
- Fig. 4 - Supplemental 2
- Fig. 4 - Supplemental 3
- Fig. 4 - Supplemental 4
- Fig. 4 - Supplemental 5
- Fig. 4 - Supplemental 6
- Fig. 4 - Supplemental 7
- Fig. 4 - Supplemental 8
- Fig. 4 - Supplemental 9
- Fig. 4 - Supplemental 10
- Fig. 4 - Supplemental 11
- Fig. 4 - Supplemental 12
- Fig. 4 - Supplemental 13
- Fig. 5
- Fig. 5 - Supplemental 1
- Fig. 5 - Supplemental 2
- Fig. 5 - Supplemental 3
- Fig. 5 - Supplemental 4
- Fig. 5 - Supplemental 5
- Fig. 5 - Supplemental 6
- Fig. 5 - Supplemental 7
- Fig. 5 - Supplemental 8
- Fig. 5 - Supplemental 9
- Fig. 5 - Supplemental 10
- Fig. 6
- Fig. 6 - Supplemental 1
- Fig. 6 - Supplemental 2
- All Figure Page
- Back to All Figure Page
Fig. 4 - Supplemental 1
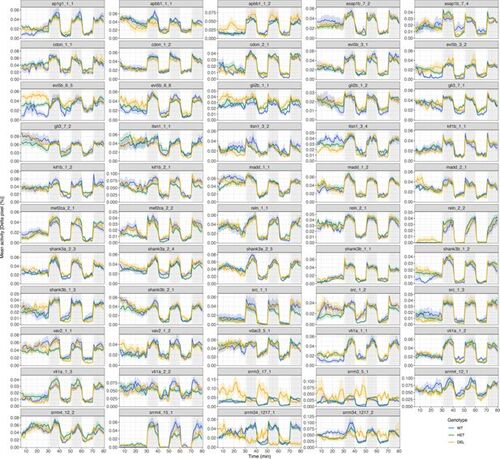
Larval activity over the time course of the experiment. Activity (percentage of Δpixels/min) for each microexon and regulator deletion line and biological replicate (clutch). Traces represent mean ± SEM across larvae from the same clutch and genotype. Dark and light periods are shown with gray or white background, respectively. For simplicity, for the srrm3/4 double mutant, WT denotes srrm3+/+,srrm4-/-, Het srrm3+/-,srrm4-/-, and DEL srrm3-/-,srrm4-/-. |
Expression Data
Expression Detail
Antibody Labeling
Phenotype Data
Phenotype Detail
Acknowledgments
This image is the copyrighted work of the attributed author or publisher, and
ZFIN has permission only to display this image to its users.
Additional permissions should be obtained from the applicable author or publisher of the image.
Full text @ Elife