
Fig. 2
- ID
- ZDB-FIG-251202-16
- Publication
- Lopez-Blanch et al., 2025 - Phenotypic impact of individual conserved neuronal microexons and their master regulators in zebrafish
- Other Figures
-
- Fig. 1
- Fig. 1 - Supplemental 1
- Fig. 2
- Fig. 2 - Supplemental 1
- Fig. 3
- Fig. 3 - Supplemental 1
- Fig. 3 - Supplemental 2
- Fig. 4
- Fig. 4 - Supplemental 1
- Fig. 4 - Supplemental 2
- Fig. 4 - Supplemental 3
- Fig. 4 - Supplemental 4
- Fig. 4 - Supplemental 5
- Fig. 4 - Supplemental 6
- Fig. 4 - Supplemental 7
- Fig. 4 - Supplemental 8
- Fig. 4 - Supplemental 9
- Fig. 4 - Supplemental 10
- Fig. 4 - Supplemental 11
- Fig. 4 - Supplemental 12
- Fig. 4 - Supplemental 13
- Fig. 5
- Fig. 5 - Supplemental 1
- Fig. 5 - Supplemental 2
- Fig. 5 - Supplemental 3
- Fig. 5 - Supplemental 4
- Fig. 5 - Supplemental 5
- Fig. 5 - Supplemental 6
- Fig. 5 - Supplemental 7
- Fig. 5 - Supplemental 8
- Fig. 5 - Supplemental 9
- Fig. 5 - Supplemental 10
- Fig. 6
- Fig. 6 - Supplemental 1
- Fig. 6 - Supplemental 2
- All Figure Page
- Back to All Figure Page
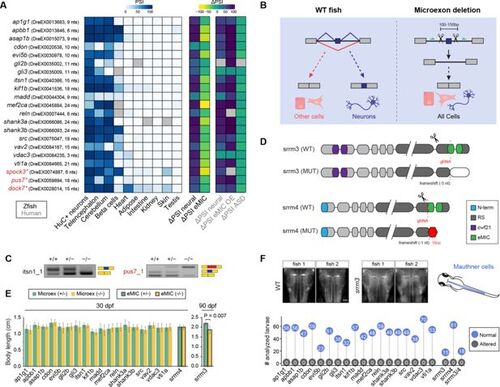
Selected neural microexons and experimental design. (A) Inclusion levels of the 21 selected conserved microexons across zebrafish tissues as well as differential inclusion in neural vs other tissues (ΔPSI neural) in zebrafish and human, change in inclusion in response to eMIC depletion in zebrafish (ΔPSI eMIC) or eMIC overexpression in human (ΔPSI eMIC OE), and change in inclusion between ASD patients and control individuals (ΔPSI ASD). The three microexons with asterisks were excluded from phenotypic analyses. (B) Schematic representation of the CRISPR-Cas9 based deletions of individual microexons. A pair of guide RNAs flanking each microexon were designed, which is expected to lead to normal gene expression without the microexon in all cells. (C) Examples of two RT-PCRs testing the inclusion of the targeted microexon upon CRISPR-Cas9 removal. itsn1_1 shows the expected clean deletion in the homozygous, while pus7_1 exhibits inclusion of a cryptic sequence of higher length (red block) (see Figure 2—figure supplement 1). (D) Schematic representation of srrm3 and srrm4 protein domains and the impact of the CRISPR-Cas9 derived mutations (from Ciampi et al., 2022). (E) Distribution of body lengths at 30 dpf for heterozygous (green) and homozygous (yellow) fish for each microexon deletion or the srrm4 mutation. For srrm3, the values are shown for 90 dpf. P-value corresponds to a two-sided t-test. Error bars correspond to standard errors. (F) Top: two representative images from WT and srrm3 homozygous mutant larvae showing staining for 3A10 in Mauthner cells (schematized on the right side). Bottom: quantification of normal and altered number of larvae with respect to Mauthner cell morphology in homozygous mutants for each microexon or regulator line. |