
Fig. 5
- ID
- ZDB-FIG-251202-35
- Publication
- Lopez-Blanch et al., 2025 - Phenotypic impact of individual conserved neuronal microexons and their master regulators in zebrafish
- Other Figures
-
- Fig. 1
- Fig. 1 - Supplemental 1
- Fig. 2
- Fig. 2 - Supplemental 1
- Fig. 3
- Fig. 3 - Supplemental 1
- Fig. 3 - Supplemental 2
- Fig. 4
- Fig. 4 - Supplemental 1
- Fig. 4 - Supplemental 2
- Fig. 4 - Supplemental 3
- Fig. 4 - Supplemental 4
- Fig. 4 - Supplemental 5
- Fig. 4 - Supplemental 6
- Fig. 4 - Supplemental 7
- Fig. 4 - Supplemental 8
- Fig. 4 - Supplemental 9
- Fig. 4 - Supplemental 10
- Fig. 4 - Supplemental 11
- Fig. 4 - Supplemental 12
- Fig. 4 - Supplemental 13
- Fig. 5
- Fig. 5 - Supplemental 1
- Fig. 5 - Supplemental 2
- Fig. 5 - Supplemental 3
- Fig. 5 - Supplemental 4
- Fig. 5 - Supplemental 5
- Fig. 5 - Supplemental 6
- Fig. 5 - Supplemental 7
- Fig. 5 - Supplemental 8
- Fig. 5 - Supplemental 9
- Fig. 5 - Supplemental 10
- Fig. 6
- Fig. 6 - Supplemental 1
- Fig. 6 - Supplemental 2
- All Figure Page
- Back to All Figure Page
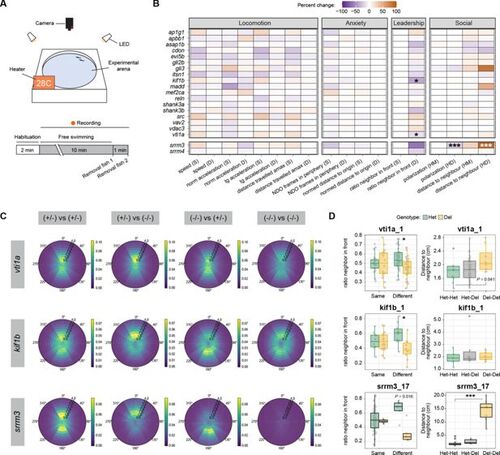
Impact of microexon misregulation on social behavior. (A) Schematic representation of the behavioral station (details in Figure 5—figure supplement 1) and experimental design for each tested pair of 30 dpf juveniles. (B) Heatmap showing the percent of change with respect to the control value for each main microexon and regulator deletion line for nine different parameters related to locomotion, anxiety or social behavior (full plots in Figure 5—figure supplements 2–10). For parameters referring to individual (locomotion, anxiety, and leadership), two comparisons are shown: the average of the fish from Del-Del pairs vs the control Het-Het pairs (homotypic pairs, same ‘S’), or the value of the Del fish with respect to the Het one within each Het-Del pair (heterotypic pairs, different ‘D’). For group parameters (polarization order and distance to neighbors), the following two comparisons are shown: Het-Het vs Het-Del (HM) and Het-Het vs Del-Del (HD). While ‘ratio neighbor in front’ (D) does not reach statistical significance under our cut-offs for srrm3 mutants due to the small sample size (N=5; p=0.016), their strongly increased leadership can be observed in panels C and D. (C) Relative position map showing the position of the other fish of the pair (right genotype) with respect to the focal fish located at the center of the map (left genotype). For instance, (+/-) vs (-/-) shows the position of the Del fish respect to the focal Het one in a Het-Del pair. The merge plot of all fish pairs for vti1a, kif1b, and srrm3 are shown. (D) Boxplots for the fish pairs shown in (C). Left: ratio in front of the non-focal fish. Lower values indicate higher leadership (i.e. more time in front). ‘Same’ corresponds to either Het-Het or Del-Del pairs and ‘Different to Het-Del pairs, with values of individual fish plotted by genotype. Right: median of the distances between the two fish throughout the time course for each genotype pair combination. p-Values correspond to Wilcoxon Rank-Sum tests for the indicated comparisons. * 0.01
|