
Fig. 6
- ID
- ZDB-FIG-251202-46
- Publication
- Lopez-Blanch et al., 2025 - Phenotypic impact of individual conserved neuronal microexons and their master regulators in zebrafish
- Other Figures
-
- Fig. 1
- Fig. 1 - Supplemental 1
- Fig. 2
- Fig. 2 - Supplemental 1
- Fig. 3
- Fig. 3 - Supplemental 1
- Fig. 3 - Supplemental 2
- Fig. 4
- Fig. 4 - Supplemental 1
- Fig. 4 - Supplemental 2
- Fig. 4 - Supplemental 3
- Fig. 4 - Supplemental 4
- Fig. 4 - Supplemental 5
- Fig. 4 - Supplemental 6
- Fig. 4 - Supplemental 7
- Fig. 4 - Supplemental 8
- Fig. 4 - Supplemental 9
- Fig. 4 - Supplemental 10
- Fig. 4 - Supplemental 11
- Fig. 4 - Supplemental 12
- Fig. 4 - Supplemental 13
- Fig. 5
- Fig. 5 - Supplemental 1
- Fig. 5 - Supplemental 2
- Fig. 5 - Supplemental 3
- Fig. 5 - Supplemental 4
- Fig. 5 - Supplemental 5
- Fig. 5 - Supplemental 6
- Fig. 5 - Supplemental 7
- Fig. 5 - Supplemental 8
- Fig. 5 - Supplemental 9
- Fig. 5 - Supplemental 10
- Fig. 6
- Fig. 6 - Supplemental 1
- Fig. 6 - Supplemental 2
- All Figure Page
- Back to All Figure Page
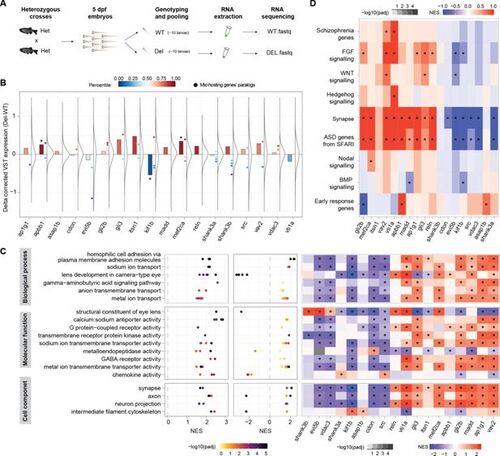
Transcriptomic analyses of 5 dpf larvae suggest potential compensatory changes. (A) Schematic representation of the experimental design. (B) Distribution of changes in gene expression (Δ corrected variance stabilizing transformation [VST] expression) between the Del and WT larvae for each main microexon deletion line, as well as change of the host gene (barplots) and of closely related paralogs (chordate or younger origin according to Biomart) (dots; Mic-hosting genes' paralogs). The color scale indicates the percentile of the expression change within the overall distribution. Asterisk on bars indicates change in the bottom or top decile. (C) Left: Gene Ontology (GO) categories (dots) clustered in related groups (rows) that are enriched among genes globally changing upon individual microexon deletions. Middle: Normalized Enrichment Scores (NES; X-axis) and adjusted p-values (color code) for the same GO categories in the comparison of srrm3 mutant larvae and WT siblings. Right: heatmap showing the NES for the gene sets comprising the union of all GO categories within each group for each specific microexon comparison. Stars indicate adjusted p-value <0.01. (D) NES for specific gene sets (Supplementary file 7) with relevance in neurobiology and/or development for each microexon deletion comparison. |