
Fig. 6
- ID
- ZDB-FIG-250820-27
- Publication
- Zini et al., 2025 - A novel stable transgenic zebrafish line expressing mCherry-tagged human alpha-synuclein in the nervous system and exhibiting all the key features of Lewy body disorders at larval stage
- Other Figures
- All Figure Page
- Back to All Figure Page
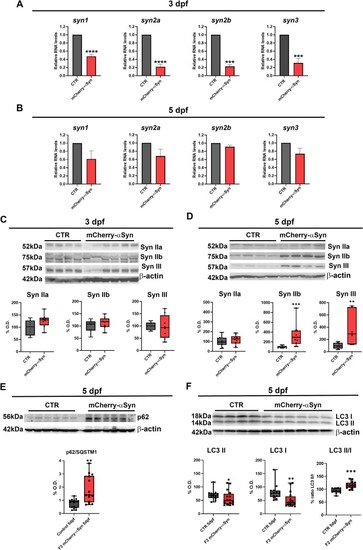
mCherry-αSyn expression affects Synapsins, p62 and LC3 levels. (A-B) mRNA expression of zebrafish synapsins at 3 and 5 dpf for control and F2 mCherry positive 20 larvae pools, relative expression was calculated with the ΔΔCt method using rpl13a as housekeeping gene: (A) at 3 dpf all synapsins are downregulated in the mCherry-αSyn larvae compared to age-matched controls (Unpaired t-test, p < 0.0001, ****, p = 0.0005, ***). (B) At 5 dpf a not significant reduction in the mRNA levels of the four synapsins genes is still present in the transgenic larvae compared to the wild-type-like controls (Unpaired t-test). (C) Western blot analysis of synapsin IIa, IIb and III protein levels at 3 dpf from 20 larvae pools of F2 mCherry-αSyn and controls: SynIIb and SynIII levels had a slight but non-significant increase in the transgenic larvae pools. Boxplots represent the distribution of 75 %, 50 %, and 25 % of the values (Mann-Whitney U test, N = 3, n = 3, 20 larvae pools). (D) Western Blot on transgenic and control larvae pools at 5 dpf showed a significant increase of Syn IIb and Syn III protein levels in the F2 mCherry-αSyn samples compared to controls (Mann-Whitney test, ** p = 0.0068, *** p = 0.0003). Boxplots represent the distribution of 75 %, 50 %, and 25 % of the values, with experiments done in triplicate, n = 5 (20 larvae pools) for each condition, samples loaded in double. (E) Western blot for p62/SQSTM1 on F2 mCherry-αSyn and wild-type-like controls at 5 dpf showed a significant increase of p62 levels in transgenic pools compared to the controls (Mann-Whitney test, ** p = 0.0018). Boxplots represent the distribution of 75 %, 50 %, and 25 % of the values, with experiments done in triplicate, n = 7 (20 larvae pools) for each condition, samples loaded in double. (F) Western blot for LC3 on F2 mCherry-αSyn and wild-type-like controls at 5 dpf, where LC3 I and II levels are significantly reduced (Mann-Whitney test, * p = 0.0499, ** p = 0.0035), while LC3 II/I ratio is higher (Mann-Whitney test, *** p < 0.0001) in transgenic larvae pools compared to controls. Boxplots represent the distribution of 75 %, 50 %, and 25 % of the values, with experiments done in triplicate, n = 5 (20 larvae pools) for each condition, samples loaded in double (C, D, E, F). Graph shows relative densitometric quantification to β-actin. |