
Fig. 2
- ID
- ZDB-FIG-250820-23
- Publication
- Zini et al., 2025 - A novel stable transgenic zebrafish line expressing mCherry-tagged human alpha-synuclein in the nervous system and exhibiting all the key features of Lewy body disorders at larval stage
- Other Figures
- All Figure Page
- Back to All Figure Page
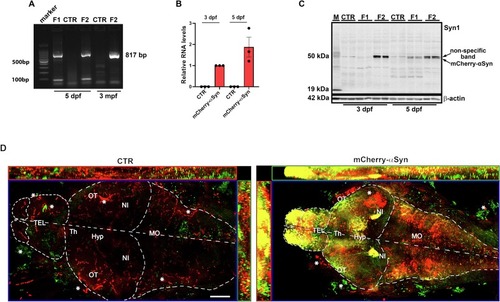
Characterization of mCherry-αSyn expression in the Tg(elavl3:mCherry-hsa.SNCA) line. (A) Representative agarose gel electrophoresis of 817 bp amplified genomic DNA extracted from Tg(elavl3:mCherry-hsa.SNCA), control larvae at 5 dpf, and fin biopsy at 3 mpf: correct amplification is visible in the F1 and F2 samples, while it is absent in control DNA. (B) Graph shows relative mRNA expression of mCherry-hsa.SNCA transgene at 3 and 5 dpf for control and F2 mCherry positive larvae pools (n = 20): relative expression was calculated with the ΔΔCt method using rpl13a as housekeeping gene. Correct amplification for the housekeeping gene was detected in all the analyzed conditions, while mCherry-hsa.SNCA primer pairs (Table 1) amplified a template only in the transgenic larvae pools (n = 20). Data are expressed as mean ± SEM, with 3 dpf mean value as reference. Experiments were done in triplicate. (C) Western blot analysis of mCherry-αSyn protein expression at 3 and 5 dpf in control, F1 and F2 20 larvae pools (n = 20), with wild-type mouse brain homogenate (M) loaded as positive control. Please note that a very faint non-specific band is detectable around 50 kDa in all zebrafish and mouse samples. This is slightly above the mCherry-αSyn signal that can be detected only in the protein extracts from transgenic larvae. Please note that F1 larvae exhibited a lower expression of mCherry-αSyn at both 3 and 5 dpf. Zebrafish samples were loaded in duplicate and β-actin was used as reference for correct total protein amount loaded. (D) Maximum intensity projection with orthogonal views of confocal images of immunofluorescence staining for 2A7 anti-αSyn antibody, highlighting different areas of the forebrain, midbrain and spinal cord of the 5 dpf F2 transgenic and control larvae: positive colocalization in neuronal cell body of mCherry and 2A7 is especially evident in the olfactory bulbs and nuclei isthmi. Red and Green aspecific signal is marked with a star close to the optic tectum and outside the brain. In the control, red signal is due to residual vessel autofluorescence, marked with a star. Scalebar 50 μm. Tel: telencephalon, OT: optic tectum, Th: thalamus, Hyp: hypothalamus, NI: nuclei isthmi, MO: medulla oblongata. (For interpretation of the references to colour in this figure legend, the reader is referred to the web version of this article.) |