
Fig. 5
- ID
- ZDB-FIG-250820-26
- Publication
- Zini et al., 2025 - A novel stable transgenic zebrafish line expressing mCherry-tagged human alpha-synuclein in the nervous system and exhibiting all the key features of Lewy body disorders at larval stage
- Other Figures
- All Figure Page
- Back to All Figure Page
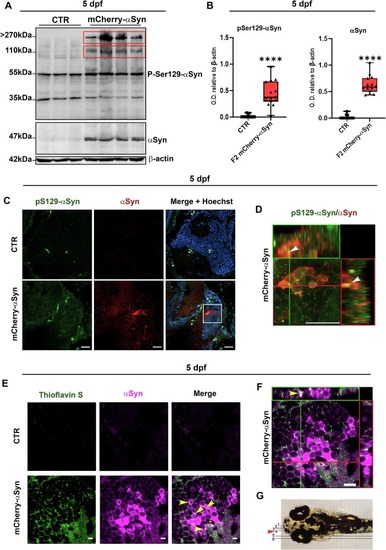
pSer129-αSyn immunoblotting and Thioflavin S/αSyn staining on F2 mCherry-αSyn 5 dpf larvae. (A) Western blot analysis showed the presence of high molecular weight pSer129-αSyn bands in the total protein extracted from F2 mCherry-αSyn pools of 20 larvae at 5 dpf. (B) Graph shows relative densitometric quantification relative to β-actin of the bands in the upper red box. Boxplots represent the distribution of 75 %, 50 %, and 25 % of the values, with experiments done in triplicate, n = 5, and samples loaded in double, Mann-Whitney U test, **** p < 0.0001. (C) Confocal images of double fluorescent immunolabelling with anti-pS129-αSyn (AF488) and anti-αSyn (2A7) (Cy5) antibodies (Table 2) on 5 dpf larval sagittal sections of control and F2 mCherry-αSyn midbrains. Non-specific signal in green is marked with a star. Scalebar 20 μm. (D) Orthogonal projection of 4× crop from image C, showing accumulation of anti-pS129-αSyn positive inclusions (arrows). Scalebar 20 μm. (E) Confocal images of the Thioflavin S-positive signal, indicative of fibrillary aggregation, in co-localization with αSyn (2A7) immunopositive labeling in the lateral medulla oblongata (MO) of transgenic and control larvae at 5 dpf. Please note that an asterisk is located nearby non-specific signals, while yellow arrows indicate Thioflavin-S/ αSyn-positive inclusions. Scalebar 10 μm. (F) Orthogonal projection of the x-axis (green rectangle) and y-axis (red rectangle) of the image presented for the mCherry-αSyn transgenic larva in panel E. Scalebar 10 μm. (G) Image adapted from online Developmental Atlas, showing region of the section displayed in (Csingle bondF) (red arrow). (For interpretation of the references to colour in this figure legend, the reader is referred to the web version of this article.) |