
Fig. 4
- ID
- ZDB-FIG-250820-25
- Publication
- Zini et al., 2025 - A novel stable transgenic zebrafish line expressing mCherry-tagged human alpha-synuclein in the nervous system and exhibiting all the key features of Lewy body disorders at larval stage
- Other Figures
- All Figure Page
- Back to All Figure Page
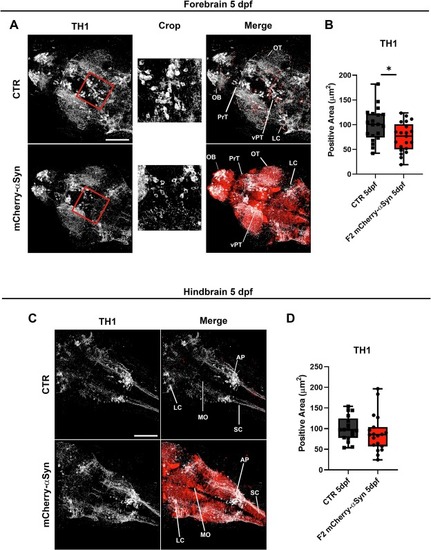
Analysis on TH1-immunopositive area in F2 mCherry-αSyn 5 dpf larvae. (A) Left panel are representative of maximum intensity projection of Z-stack images of TH1 immunolabelling zebrafish forebrain. Crop images of the TH1 channel highlight reduction of the TH1-positive area in the ventral midbrain. Right panels represent the merge of maximum intensity projections of TH1-immunolabelling and mCherry-αSyn signal. OB: olfactory bulb, OT: optic tectum, PrT: pretectal area, vPT: ventral posterior tuberculum. LC: locus coeruleus (B) Graphs showing the analysis of TH1-positive area in the forebrain of control and mCherry-αSyn 5dpf larvae. Single data points are representative of the total surface area of TH1-positive circuits in the forebrain, measured with Imaris surface tool. Boxplots represent the distribution of 75 %, 50 %, and 25 % of the values. Whiskers indicate the upper and lower extremes of the dataset. Transgenic larvae showed a significant reduction in the total TH1-positive area of the forebrain compared to controls with Mann Mann-Whitney U test (* p = 0.0264), n = 20 controls and n = 21 transgenics. (C) Maximum intensity projection of Z-stack images of TH1-positive area in the hindbrain. (D) Graphs showing the analysis of TH1-positive area in the hindbrain of control and mCherry-αSyn 5dpf larvae. Single data points are representative of the total surface area of TH1-positive circuits in the forebrain, measured with Imaris surface tool. Boxplots represent the distribution of 75 %, 50 %, and 25 % of the values. Whiskers indicate the upper and lower extremes of the dataset. No significant difference could be detected between control and transgenic larvae. Scalebar 100 μm. LC: locus coeruleus, MO: medulla oblongata, AP: area postrema, SC: spinal cord. |