
- Title
-
A novel stable transgenic zebrafish line expressing mCherry-tagged human alpha-synuclein in the nervous system and exhibiting all the key features of Lewy body disorders at larval stage
- Authors
- Zini, S., Muscò, A., Longhena, F., Faustini, G., Tobia, C., Borsani, G., Spillantini, M.G., Zizioli, D., Bellucci, A.
- Source
- Full text @ Neurobiol. Dis.
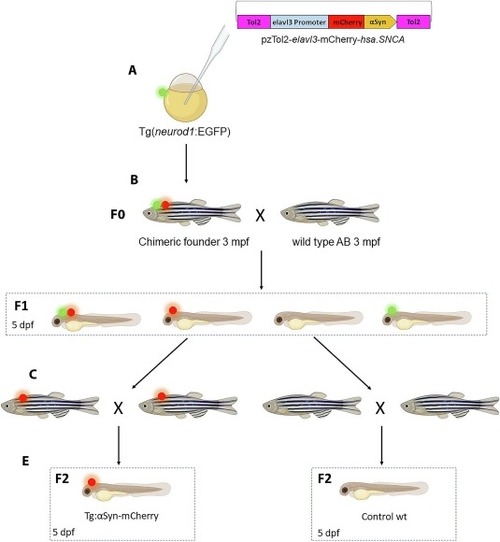
Generation of transgenic Tg(elavl3:mCherry-hsa.SNCA) and control lines. Schematic representation of the breeding procedure used to obtain the F2 and control larvae to perform all experiments. (A) 600 ng/μL of pzTol2-elavl3-mCherry-hsa.SNCA and 250 ng/μl of Tol2 mRNA were injected into embryos at one-cell-stage of the transgenic line Tg(neurod1:EGFP). (B) At 3 months post fertilization (mpf) chimeric animals that showed expression of both mCherry-αSyn (red dot) and EGFP (green dot) were crossed with wild-type AB fishes: parents able to transmit the transgene were selected as founders (F0) and were outcrossed with AB fishes to obtain F1 generation in which four phenotype were present: Tg(neurod1:EGFP)+ / Tg(elavl3:mCherry-hsa.SNCA) + larvae showed both green and red fluorescence, Tg(neurod1:EGFP)+ / Tg(elavl3:mCherry-hsa.SNCA)- larvae showed only green fluorescence, Tg(neurod1:EGFP)- / Tg(elavl3:mCherry-hsa.SNCA) + larvae had only mCherry-αSyn expression, while the Tg(neurod1:EGFP)- / Tg(elavl3:mCherry-hsa.SNCA)- had no fluorescence expression or transgenic construct integrated in the genome. (C) F1 Tg(neurod1:EGFP)- / Tg(elavl3:mCherry-hsa.SNCA) + (red spot) and Tg(neurod1:EGFP)- / Tg(elavl3:mCherry-hsa.SNCA)- (no spot) were selected and brought to adulthood: at 3 mpf they were inbred to generate the F2 larvae used for this study (D). (For interpretation of the references to colour in this figure legend, the reader is referred to the web version of this article.) |
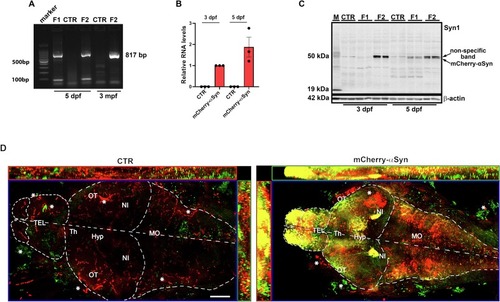
Characterization of mCherry-αSyn expression in the Tg(elavl3:mCherry-hsa.SNCA) line. (A) Representative agarose gel electrophoresis of 817 bp amplified genomic DNA extracted from Tg(elavl3:mCherry-hsa.SNCA), control larvae at 5 dpf, and fin biopsy at 3 mpf: correct amplification is visible in the F1 and F2 samples, while it is absent in control DNA. (B) Graph shows relative mRNA expression of mCherry-hsa.SNCA transgene at 3 and 5 dpf for control and F2 mCherry positive larvae pools (n = 20): relative expression was calculated with the ΔΔCt method using rpl13a as housekeeping gene. Correct amplification for the housekeeping gene was detected in all the analyzed conditions, while mCherry-hsa.SNCA primer pairs (Table 1) amplified a template only in the transgenic larvae pools (n = 20). Data are expressed as mean ± SEM, with 3 dpf mean value as reference. Experiments were done in triplicate. (C) Western blot analysis of mCherry-αSyn protein expression at 3 and 5 dpf in control, F1 and F2 20 larvae pools (n = 20), with wild-type mouse brain homogenate (M) loaded as positive control. Please note that a very faint non-specific band is detectable around 50 kDa in all zebrafish and mouse samples. This is slightly above the mCherry-αSyn signal that can be detected only in the protein extracts from transgenic larvae. Please note that F1 larvae exhibited a lower expression of mCherry-αSyn at both 3 and 5 dpf. Zebrafish samples were loaded in duplicate and β-actin was used as reference for correct total protein amount loaded. (D) Maximum intensity projection with orthogonal views of confocal images of immunofluorescence staining for 2A7 anti-αSyn antibody, highlighting different areas of the forebrain, midbrain and spinal cord of the 5 dpf F2 transgenic and control larvae: positive colocalization in neuronal cell body of mCherry and 2A7 is especially evident in the olfactory bulbs and nuclei isthmi. Red and Green aspecific signal is marked with a star close to the optic tectum and outside the brain. In the control, red signal is due to residual vessel autofluorescence, marked with a star. Scalebar 50 μm. Tel: telencephalon, OT: optic tectum, Th: thalamus, Hyp: hypothalamus, NI: nuclei isthmi, MO: medulla oblongata. (For interpretation of the references to colour in this figure legend, the reader is referred to the web version of this article.) |
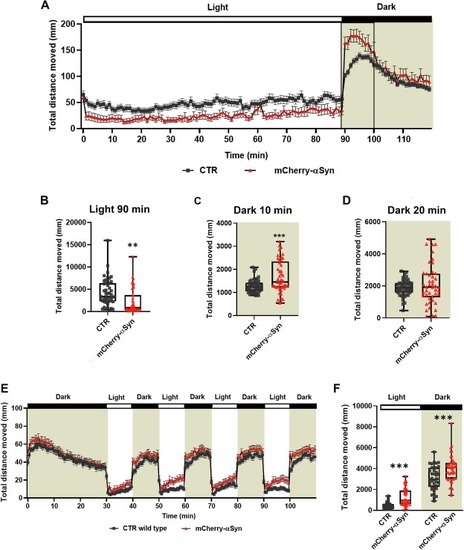
Behavioral analysis of F2 transgenic and control larvae at 5 dpf using Noldus Danio Vision chamber and a 24-well arena plate. (A) Time-course of the distance travelled by the mCherry-αSyn and control larvae during 120 min observation, with the first 90 min spent under the light and the last 30 min in the dark (indicated by the grey area), each data point represents mean ± SEM of all the different subjects, four experiments were cumulated (n = 48 CTR, n = 45 Tg). (B) Graph shows the total distance moved during 90 min of full illumination. Transgenic larvae display a statistically significant reduction in their motor activity (Unpaired t-test, ** p = 0.0011). (C) The graph shows total distance moved in the first 10 min of the dark phase, with a significant increase in the activity of the transgenic larvae compared to control siblings (Unpaired t-test, *** p = 0.0005). (D) Activity pattern during the last 20 min of the dark phase. No significant difference could be observed between controls and transgenic larvae (Unpaired t-test). (E) Time-course of the distance travelled by the transgenic versus control larvae during the WLR. The first 30 min were considered as habituation to the chamber, each data point represents the mean distance swum (± SEM) of all the different subjects (n = 37 CTR, n = 46 Tg). (F) Relative quantification of the total distance moved during the four light periods and the four dark periods (indicated by the grey area) of the swimming behavior analysis. Data from four independent experiments were analyzed by Two-way ANOVA (Interaction F (1, 162) = 23.12, p < 0.0001; photoperiod (light/dark) F (1, 162) = 17,484, p < 0.0001; genotype F (1, 162) = 1053, p < 0.0001) plus Sidak's multiple comparison test (*** p < 0.0003). (B, C, D, F) Boxplots represent the distribution of 75 %, 50 %, and 25 % of the values. Whiskers indicate the upper and lower extremes of the dataset. |
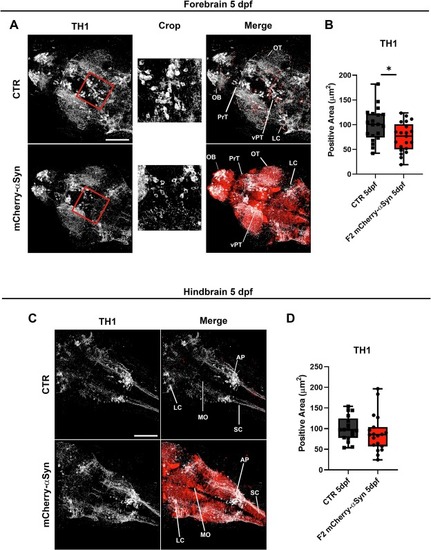
Analysis on TH1-immunopositive area in F2 mCherry-αSyn 5 dpf larvae. (A) Left panel are representative of maximum intensity projection of Z-stack images of TH1 immunolabelling zebrafish forebrain. Crop images of the TH1 channel highlight reduction of the TH1-positive area in the ventral midbrain. Right panels represent the merge of maximum intensity projections of TH1-immunolabelling and mCherry-αSyn signal. OB: olfactory bulb, OT: optic tectum, PrT: pretectal area, vPT: ventral posterior tuberculum. LC: locus coeruleus (B) Graphs showing the analysis of TH1-positive area in the forebrain of control and mCherry-αSyn 5dpf larvae. Single data points are representative of the total surface area of TH1-positive circuits in the forebrain, measured with Imaris surface tool. Boxplots represent the distribution of 75 %, 50 %, and 25 % of the values. Whiskers indicate the upper and lower extremes of the dataset. Transgenic larvae showed a significant reduction in the total TH1-positive area of the forebrain compared to controls with Mann Mann-Whitney U test (* p = 0.0264), n = 20 controls and n = 21 transgenics. (C) Maximum intensity projection of Z-stack images of TH1-positive area in the hindbrain. (D) Graphs showing the analysis of TH1-positive area in the hindbrain of control and mCherry-αSyn 5dpf larvae. Single data points are representative of the total surface area of TH1-positive circuits in the forebrain, measured with Imaris surface tool. Boxplots represent the distribution of 75 %, 50 %, and 25 % of the values. Whiskers indicate the upper and lower extremes of the dataset. No significant difference could be detected between control and transgenic larvae. Scalebar 100 μm. LC: locus coeruleus, MO: medulla oblongata, AP: area postrema, SC: spinal cord. |
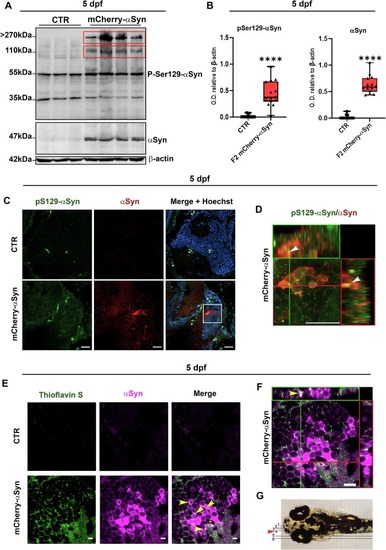
pSer129-αSyn immunoblotting and Thioflavin S/αSyn staining on F2 mCherry-αSyn 5 dpf larvae. (A) Western blot analysis showed the presence of high molecular weight pSer129-αSyn bands in the total protein extracted from F2 mCherry-αSyn pools of 20 larvae at 5 dpf. (B) Graph shows relative densitometric quantification relative to β-actin of the bands in the upper red box. Boxplots represent the distribution of 75 %, 50 %, and 25 % of the values, with experiments done in triplicate, n = 5, and samples loaded in double, Mann-Whitney U test, **** p < 0.0001. (C) Confocal images of double fluorescent immunolabelling with anti-pS129-αSyn (AF488) and anti-αSyn (2A7) (Cy5) antibodies (Table 2) on 5 dpf larval sagittal sections of control and F2 mCherry-αSyn midbrains. Non-specific signal in green is marked with a star. Scalebar 20 μm. (D) Orthogonal projection of 4× crop from image C, showing accumulation of anti-pS129-αSyn positive inclusions (arrows). Scalebar 20 μm. (E) Confocal images of the Thioflavin S-positive signal, indicative of fibrillary aggregation, in co-localization with αSyn (2A7) immunopositive labeling in the lateral medulla oblongata (MO) of transgenic and control larvae at 5 dpf. Please note that an asterisk is located nearby non-specific signals, while yellow arrows indicate Thioflavin-S/ αSyn-positive inclusions. Scalebar 10 μm. (F) Orthogonal projection of the x-axis (green rectangle) and y-axis (red rectangle) of the image presented for the mCherry-αSyn transgenic larva in panel E. Scalebar 10 μm. (G) Image adapted from online Developmental Atlas, showing region of the section displayed in (Csingle bondF) (red arrow). (For interpretation of the references to colour in this figure legend, the reader is referred to the web version of this article.) |
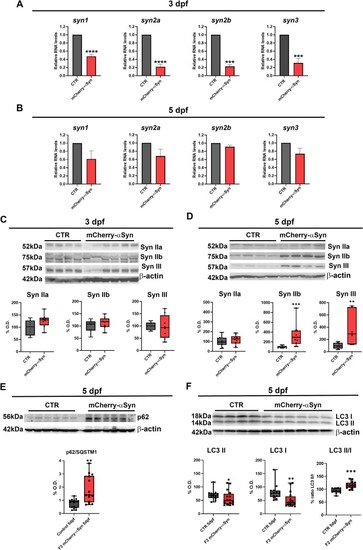
mCherry-αSyn expression affects Synapsins, p62 and LC3 levels. (A-B) mRNA expression of zebrafish synapsins at 3 and 5 dpf for control and F2 mCherry positive 20 larvae pools, relative expression was calculated with the ΔΔCt method using rpl13a as housekeeping gene: (A) at 3 dpf all synapsins are downregulated in the mCherry-αSyn larvae compared to age-matched controls (Unpaired t-test, p < 0.0001, ****, p = 0.0005, ***). (B) At 5 dpf a not significant reduction in the mRNA levels of the four synapsins genes is still present in the transgenic larvae compared to the wild-type-like controls (Unpaired t-test). (C) Western blot analysis of synapsin IIa, IIb and III protein levels at 3 dpf from 20 larvae pools of F2 mCherry-αSyn and controls: SynIIb and SynIII levels had a slight but non-significant increase in the transgenic larvae pools. Boxplots represent the distribution of 75 %, 50 %, and 25 % of the values (Mann-Whitney U test, N = 3, n = 3, 20 larvae pools). (D) Western Blot on transgenic and control larvae pools at 5 dpf showed a significant increase of Syn IIb and Syn III protein levels in the F2 mCherry-αSyn samples compared to controls (Mann-Whitney test, ** p = 0.0068, *** p = 0.0003). Boxplots represent the distribution of 75 %, 50 %, and 25 % of the values, with experiments done in triplicate, n = 5 (20 larvae pools) for each condition, samples loaded in double. (E) Western blot for p62/SQSTM1 on F2 mCherry-αSyn and wild-type-like controls at 5 dpf showed a significant increase of p62 levels in transgenic pools compared to the controls (Mann-Whitney test, ** p = 0.0018). Boxplots represent the distribution of 75 %, 50 %, and 25 % of the values, with experiments done in triplicate, n = 7 (20 larvae pools) for each condition, samples loaded in double. (F) Western blot for LC3 on F2 mCherry-αSyn and wild-type-like controls at 5 dpf, where LC3 I and II levels are significantly reduced (Mann-Whitney test, * p = 0.0499, ** p = 0.0035), while LC3 II/I ratio is higher (Mann-Whitney test, *** p < 0.0001) in transgenic larvae pools compared to controls. Boxplots represent the distribution of 75 %, 50 %, and 25 % of the values, with experiments done in triplicate, n = 5 (20 larvae pools) for each condition, samples loaded in double (C, D, E, F). Graph shows relative densitometric quantification to β-actin. |