
Fig. 3
- ID
- ZDB-FIG-250820-24
- Publication
- Zini et al., 2025 - A novel stable transgenic zebrafish line expressing mCherry-tagged human alpha-synuclein in the nervous system and exhibiting all the key features of Lewy body disorders at larval stage
- Other Figures
- All Figure Page
- Back to All Figure Page
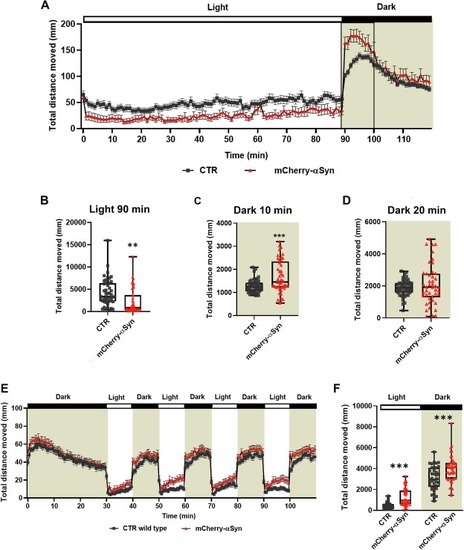
Behavioral analysis of F2 transgenic and control larvae at 5 dpf using Noldus Danio Vision chamber and a 24-well arena plate. (A) Time-course of the distance travelled by the mCherry-αSyn and control larvae during 120 min observation, with the first 90 min spent under the light and the last 30 min in the dark (indicated by the grey area), each data point represents mean ± SEM of all the different subjects, four experiments were cumulated (n = 48 CTR, n = 45 Tg). (B) Graph shows the total distance moved during 90 min of full illumination. Transgenic larvae display a statistically significant reduction in their motor activity (Unpaired t-test, ** p = 0.0011). (C) The graph shows total distance moved in the first 10 min of the dark phase, with a significant increase in the activity of the transgenic larvae compared to control siblings (Unpaired t-test, *** p = 0.0005). (D) Activity pattern during the last 20 min of the dark phase. No significant difference could be observed between controls and transgenic larvae (Unpaired t-test). (E) Time-course of the distance travelled by the transgenic versus control larvae during the WLR. The first 30 min were considered as habituation to the chamber, each data point represents the mean distance swum (± SEM) of all the different subjects (n = 37 CTR, n = 46 Tg). (F) Relative quantification of the total distance moved during the four light periods and the four dark periods (indicated by the grey area) of the swimming behavior analysis. Data from four independent experiments were analyzed by Two-way ANOVA (Interaction F (1, 162) = 23.12, p < 0.0001; photoperiod (light/dark) F (1, 162) = 17,484, p < 0.0001; genotype F (1, 162) = 1053, p < 0.0001) plus Sidak's multiple comparison test (*** p < 0.0003). (B, C, D, F) Boxplots represent the distribution of 75 %, 50 %, and 25 % of the values. Whiskers indicate the upper and lower extremes of the dataset. |