
FIGURE
Fig. 3 - Supplemental 1
- ID
- ZDB-FIG-250814-99
- Publication
- Hsu et al., 2025 - Single cell transcriptomes of zebrafish germline reveal progenitor types and feminization by Foxl2l
- Other Figures
-
- Fig. 1
- Fig. 1 - Supplemental 1
- Fig. 1 - Supplemental 2
- Fig. 1 - Supplemental 3
- Fig. 1 - Supplemental 4
- Fig. 2
- Fig. 2 - Supplemental 1
- Fig. 3
- Fig. 3 - Supplemental 1
- Fig. 3 - Supplemental 2
- Fig. 3 - Supplemental 3
- Fig. 3 - Supplemental 4
- Fig. 4
- Fig. 4 - Supplemental 1
- Fig. 5
- Fig. 5 - Supplemental 1
- Fig. 6
- All Figure Page
- Back to All Figure Page
Fig. 3 - Supplemental 1
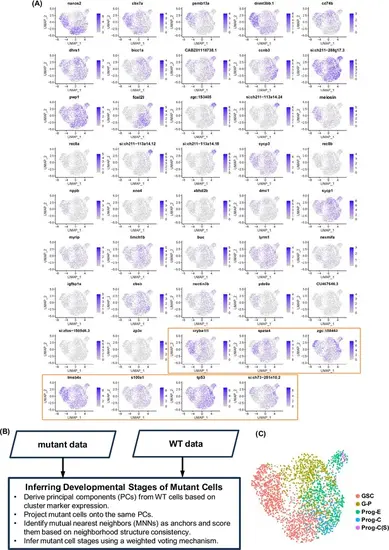
Transcriptome analysis of mutant germ cells. (A) Expression of 27 wild-type (WT) top marker genes and mutant top marker genes (in orange box) in mutant cells shown by Uniform Manifold Approximation and Projection (UMAP). The scales of the scores are shown at the right. (B) Flowchart of the inferring developmental stages of mutant cells. (C) Mutant cells shown in UMAP. Color of each mutant cell represents annotated developmental stage. |
Expression Data
Expression Detail
Antibody Labeling
Phenotype Data
Phenotype Detail
Acknowledgments
This image is the copyrighted work of the attributed author or publisher, and
ZFIN has permission only to display this image to its users.
Additional permissions should be obtained from the applicable author or publisher of the image.
Full text @ Elife